. 2016 Jun 21;5:e15635. doi: 10.7554/eLife.15635

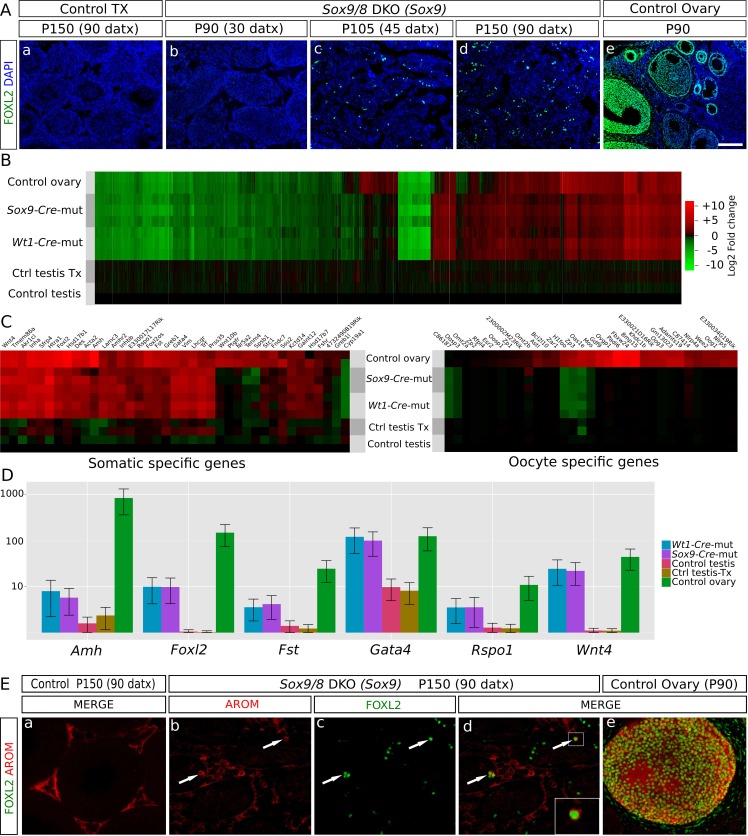
Figure 2. Genetic reprogramming in somatic cells of adult Sox9/8 SC-DKO (Sox9).

(A) Expression of FOXL2 (green fluorescence) in P150 (90 datx) TX-treated control (Sox9f/f;Sox8-/-) (a) and in Sox9/8 SC-DKO (Sox9) mouse testes analyzed at P90 (30 datx) (b), P105 (45 datx) (c), and P150 (90 datx) (d) as well as in a P 90 control ovary (e). (B) Heatmap showing the 12,380 genes found to be differentially expressed at alpha < 0.005 when comparing control (Sox9f/f) and mutant adult gonads. The log2(FPKM+1) of each gene in each condition has been divided by the corresponding value in control testis. Gene expression has not been altered by the TX treatment. Red colors indicate genes upregulated with respect to their expression levels in control testis and green colors indicate downregulated genes. (C) Expression heatmaps of selected ovarian somatic-specific and oocyte-specific genes. (D) Expression bar plots of six relevant ovarian somatic-specific genes upregulated in mutant testes. (E) Aromatase (red) and FOXL2 (green) immunofluorescence staining of TX-treated control (Sox9f/f;Sox8-/-) testis (a), mutant testes (b–d), and control ovary (e). Arrows mark reprogrammed Sertoli cells showing simultaneous expression of Aromatase and FOXL2. Scale bar shown in Ae represents 150 µm in A and 75 µm in E.

DOI: http://dx.doi.org/10.7554/eLife.15635.012

Figure 2—source data 1. Genes with significant differential expression among untreated controls, TX-treated controls, Sox8/9 SC-DKO mutants and control ovary at P150 (90 datx) identified from the bioinformatic analysis of our transcriptome.
DOI: 10.7554/eLife.15635.013

Figure 2.

Figure 2—figure supplement 1. Expression of Foxl2 in somatic cells of adult Sox9/8 DKO (Wt1).

Figure 2—figure supplement 1.

Immunofluorescence for FOXL2 (green fluorescence) in P150 (90 datx) TX-treated control (Sox9f/f;Sox8-/-) (a) and Sox9/8 DKO (Wt1) mouse testes analyzed at P90 (30 datx) (b), P105 (45 datx) (c), and P150 (90 datx) (d) as well as in a control ovary (e). Scale bar shown in e represents 150 µm for all the micrographs.
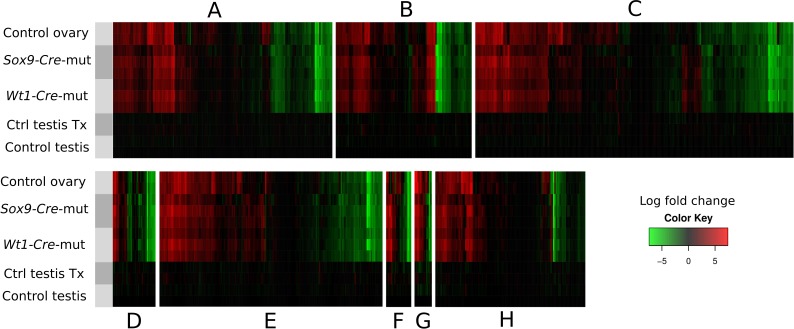
Figure 2—figure supplement 2. Heatmaps showing the expression of genes involved in 8 selected pathways (AH), relative to their expression in control testes.

Figure 2—figure supplement 2.

Gene sets where obtained from the Pathway Unification Database except for the Myosin genes Family that where obtained from the list of differentially expressed genes. The pathways, URL, and number of genes of each paths are as follow: (A) Sertoli-Sertoli Cell Junction Dynamics (http://pathcards.genecards.org/pathway/543) 213 genes (B) Germ Cell-Sertoli Cell Junction Dynamics (http://pathcards.genecards.org/pathway/1181) 140 genes (C) Epithelial Tight Junctions (http://pathcards.genecards.org/pathway/448) 329 genes (D) Regulation of Microtubule Cytoskeleton (http://pathcards.genecards.org/pathway/792) 44 genes (E) Regulation of actin cytoskeleton SuperPath (http://pathcards.genecards.org/card/regulation_of_actin_cytoskeleton) 230 genes (F) Myosin Family 26 genes (G) Cell-extracellular matrix interactions (http://pathcards.genecards.org/pathway/286) 18 genes (H) Cell adhesion molecules (http://pathcards.genecards.org/pathway/1823) 145 genes The complete lists of genes are included in Supplementary file 1.
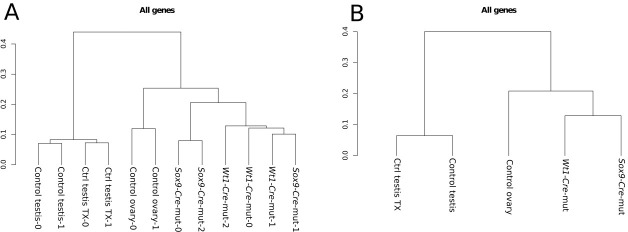
Figure 2—figure supplement 3. Cluster analysis of (A) replicates and (B) conditions.

Figure 2—figure supplement 3.

The global gene expression patterns of mutants are closer to the expression in ovaries than to that in normal testes. Both controls with and without Tamoxifen treatment also group together as expected.
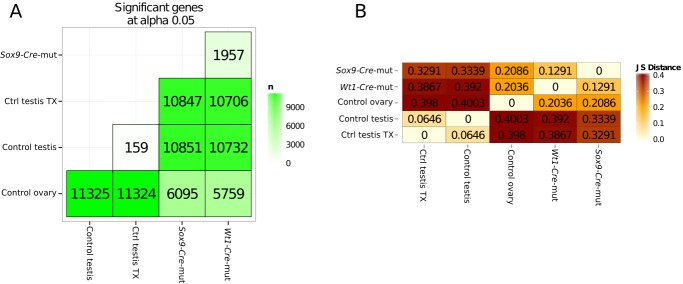
Figure 2—figure supplement 4. Quantification of genes with differential expression and Jensen–Shannon (JS) distances between conditions.

Figure 2—figure supplement 4.

(A) Number of genes showing differential expression in pairwise comparisons of the different conditions.
(B) Jensen–Shannon (JS) distances heatmap between conditions.