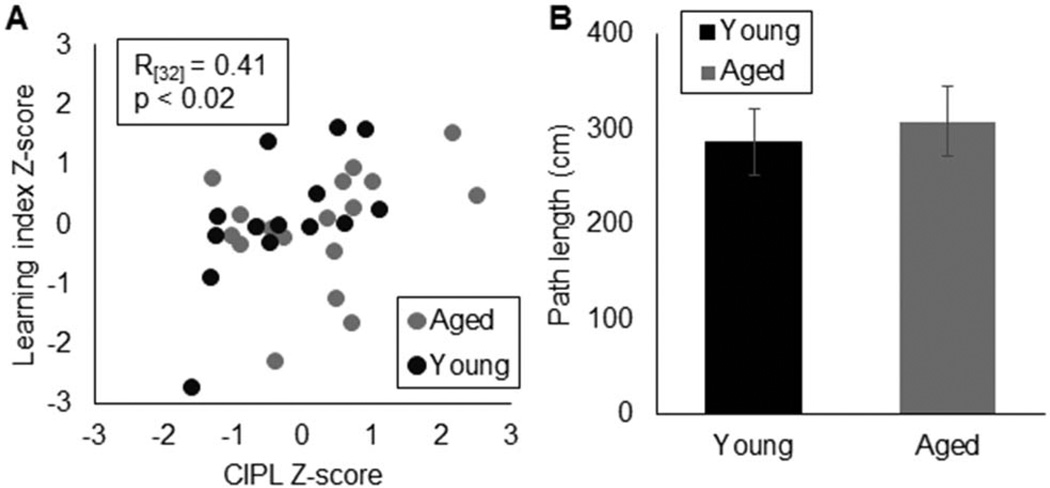
Figure 6.
Validity of Morris water maze test data. (A) Relationship between normalized (Z-score transformed) CIPL values for training Block 4 (X-axis) and Spatial Learning Index (Y-axis). These two measures were significantly correlated (R(31)= 0.41, p< .02; Pearson’s), demonstrating the internal reliability of this water maze procedure. (B) Mean path length (Y-axis) of rats during the visually cued version of the water maze was not significantly different between age groups (T(30)= 0.41, p= .68). This indicates that the aged rats did not suffer from gross sensorimotor impairments. Error bars show +/−1 standard error of the mean.

