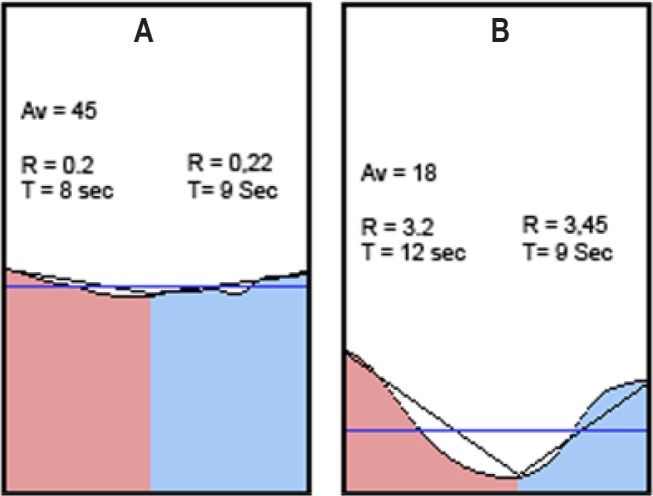
Figure 2.

Graphic representation of two respiratory events. In the first, the respiratory signal's envelope falls very slightly compared to Av, the mean respiratory flow value (horizontal blue line). The second meets pathological event criteria. The fall in respiratory flow in its entry stage (red) and the rise in its exit stage (blue) are both much sharper in relation to the mean respiratory movement value. Av, average of the respiratory air flow signal.
