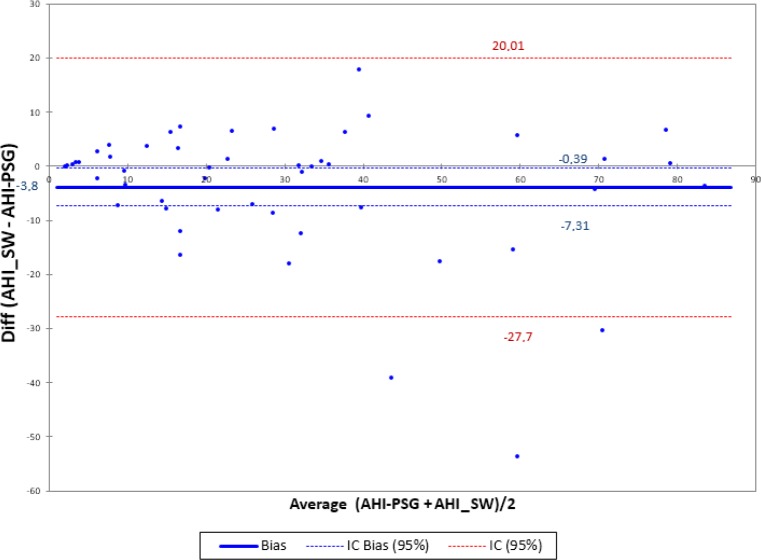
Figure 7.
Bland-Altman plot for polysomnography (PSG) and SleepWise (SW) apnea-hypopnea index (AHI) shows an average difference of −3.8, which would indicate a slight tendency of SleepWise to underdiagnose. However, this is not a systematic error of the system because this trend was triggered by three samples. In these three samples, despite the correct ranking of the severity of obstructive sleep apnea (OSA), the error in the computation of AHI was very large. Such samples can be observed clearly outside the confidence interval for the difference of 95% of the samples [−27; 20] and maybe we would consider them as outliers. Nevertheless, the limits of agreement are calculated [−7.3; −0.39] indicating a good level of equivalence between the two systems. The cause of error in these three samples is specifically treated in the discussion of the article. Except for these three samples, we observe a uniformly distributed trend or inconsistent variability along the axis.

