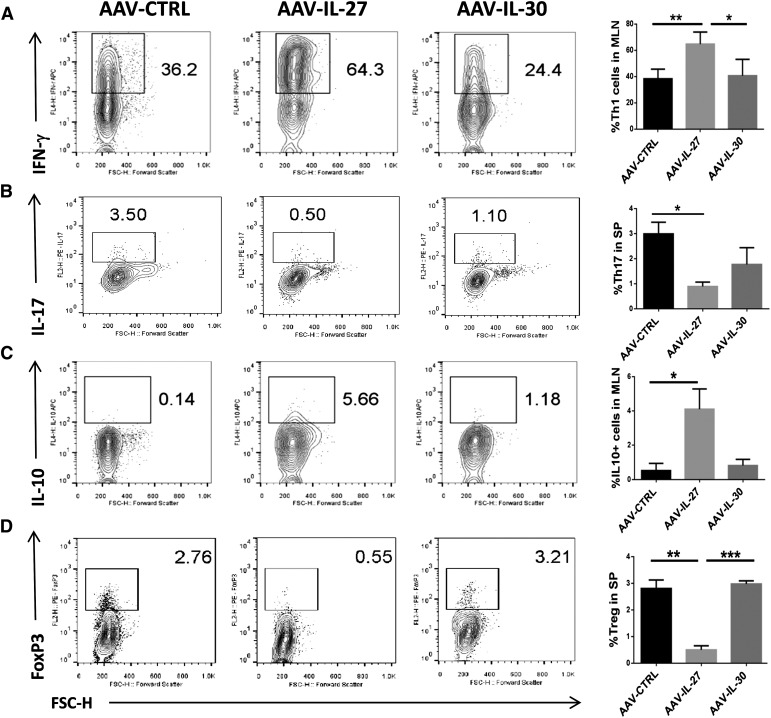
Figure 3. T cell subsets in the lymphoid organs of mice receiving different treatments.
Lymphocytes were stained with fluorescence-labeled anti-CD4 and anti-IFN-γ, anti-IL-17A, anti-IL-10, or anti-FoxP3, as described in Materials and Methods. FACS analysis was then performed to quantify Th1 (A), Th17 (B), IL-10-producing Tr1 (C), and Treg (D) populations. Representative plots from each group were shown on the left and summarized as means ± sd. Statistical analysis was performed using the unpaired Student’s t test. *P < 0.05; **P < 0.01; ***P < 0.001. FL2/4-H, Fluorescence 2/4-height; APC, allophycocyanin; FSC-H, forward-scatter-height; SP, spleen.

