
Figure 6. Gyrification index for the individuals in the IXI dataset.
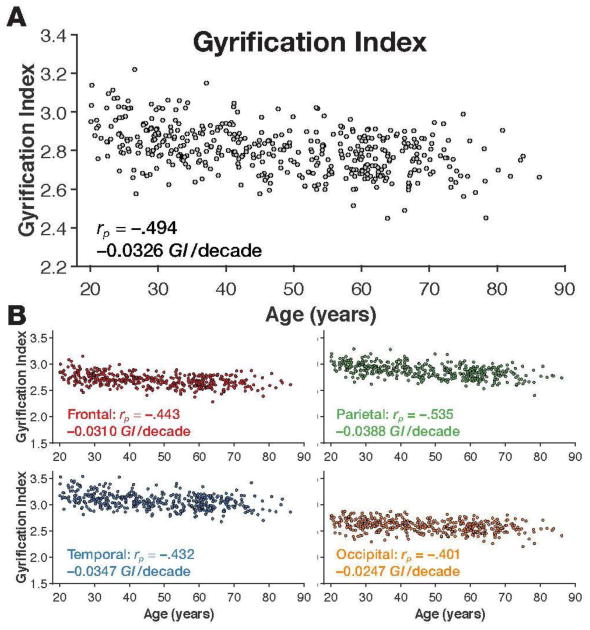
Panel A shows the scatter plot of age and whole-brain gyrification index, along with the correlation and slope. Scatter plots of age and mean gyrification index for each lobe, are shown in panel B, along with the respective correlations and slopes.