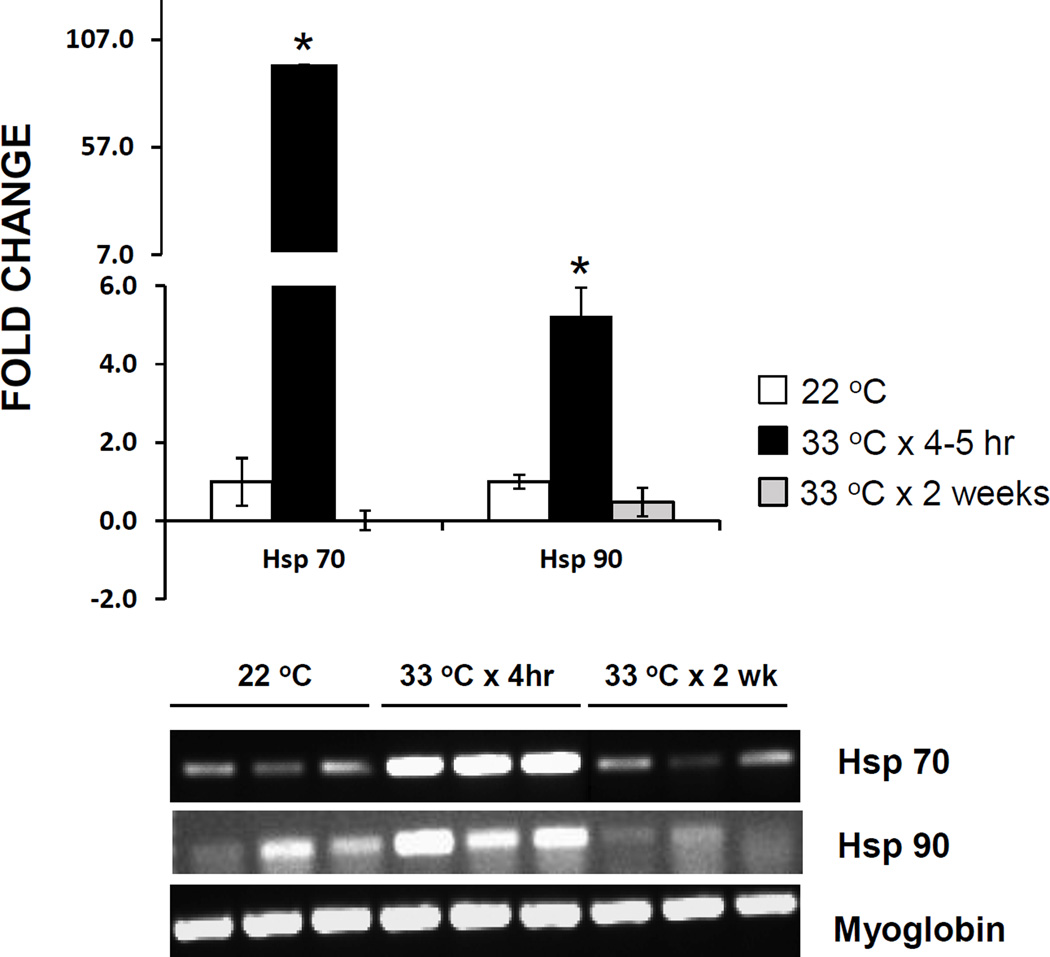
Figure 6.
Expression of Hsp 70 and Hsp 90 in Biomphalaria glabrata incubated at 33 °C for 4–5 h or 2 weeks, versus snails removed from room temperature (22 °C) aquaria (controls). Graph depicts mean fold change in expression in 3 snails at each treatment, each snail sample run in triplicate. *, mean differs significantly from that of controls (P < 0.05). Error bars indicate standard deviation. Gel photograph shows results of RT-PCR amplification of Hsp 70, Hsp 90, and myoglobin cDNA in the 3 snails from each treatment category.

