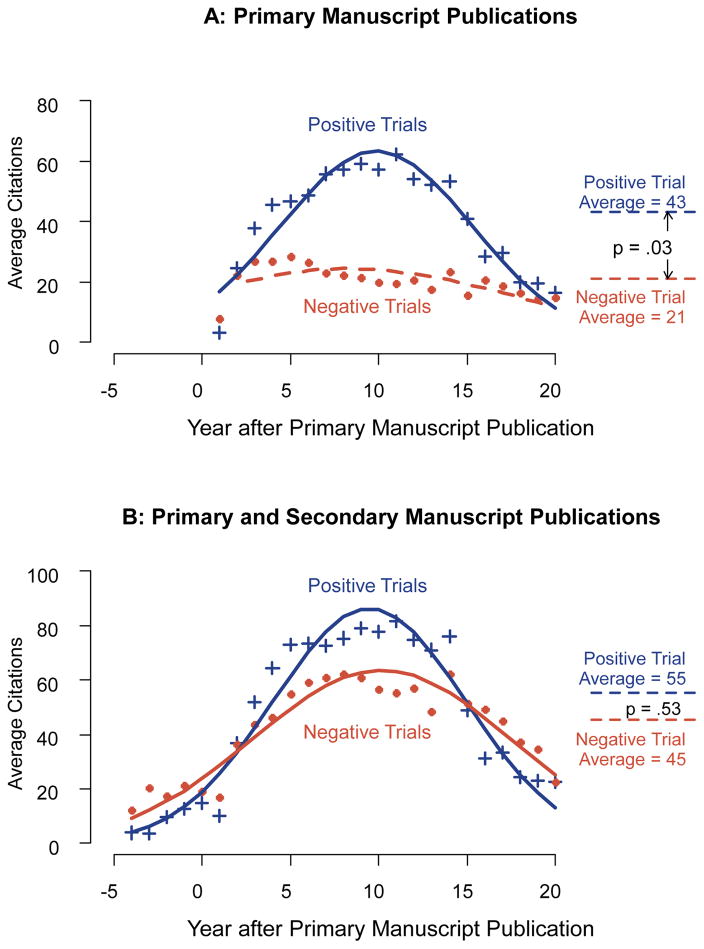
Figure 2.
Average citations by year after primary manuscript publication for primary manuscripts (Panel A) and both primary and secondary manuscripts (panel B). The solid blue lines show the model fitted results for positive trials, and the solid red lines show the model fitted results for negative trials. The blue crosses indicate observed mean number of citations for positive trials, and the red dots indicate observed mean number of citations for negative trials. The observed and fitted values occurring prior to the primary manuscript publication year were due to citations from secondary publications associated with a given trial (for instance, articles reporting on the trial design). Citation counts for the first 20 years after primary manuscript publication were included for the analysis of primary manuscripts only. For the analysis of primary and secondary manuscripts, citation counts from 5 years prior to primary manuscript publication to 20 years after primary manuscript publication were included.

