
Figure 1.
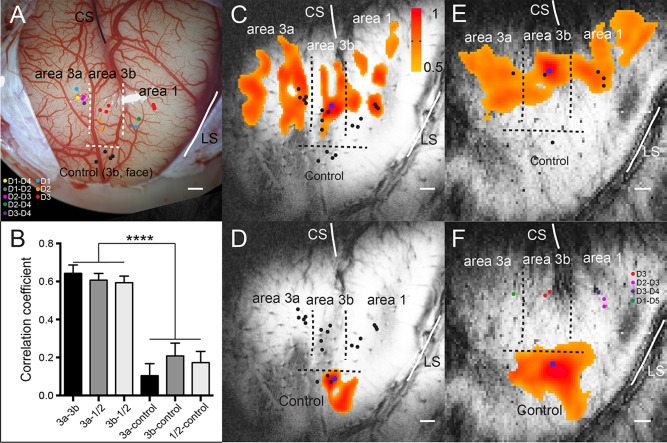
Functional connectivity revealed by resting state fMRI signals within S1 subregions (areas 3a, 3b, 1/2) of squirrel monkeys. (A) Electrophysiological map (blood vessel map) of S1 cortex (areas 3a, 3b, 1/2) of subject SM‐H with dots indicating electrode penetration sites, where neurons with receptive fields on palm, digits, and face were isolated in subject SM‐H. CS: central sulcus. LS: lateral sulcus. Dotted lines represent estimated inter‐areal borders between areas 3a, 3b, and 1/2, and between digit and face. Color dots indicate the microelectrode penetration sites and the receptive fields of the neurons isolated at each site. (B) Bar plots show correlation coefficient values between three S1 digit ROI pairs: area 3a and area 3b (3a–3b), area 3a and area 1/2 (3a–A1), and area 3b and area 1/2 (3b–A1); and between S1 digit sub‐regions and control area 3b face region: area 3a and control (3a–control), area 3b and control (3b–control) and area 1/2 and control (A1–control). ****p < 0.0001. (C and D, E and F) The connectivity maps of seeds (blue dots) in area 3b digit 3 (D3) and control face locations in subjects SM‐H and SM‐R, respectively. The connectivity maps were presented with threshold of r > 0.5. Scale bar represents 1 mm.