
Figure 2.
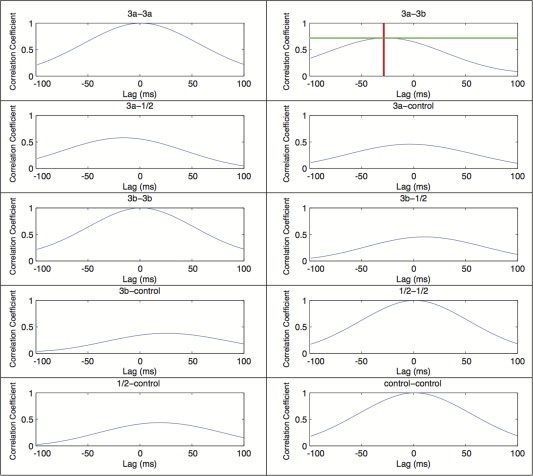
Representative correlation coefficient and lag plots of instantaneous amplitudes of different ROI pairs from one subject. This figure shows correlation coefficient plots of the delta (1–4 Hz) power band of instantaneous amplitudes populated via the Hilbert transform (Adhikari et al., 2010). The title of each plot displays the ROI pair, the y‐axis is the correlation coefficient, and the x‐axis is the temporal offset (lag) between the area pairs. The areas 3a and 3b graph shows an example measurement of a maximum amplitude and lag between an electrode pair. The horizontal line shows areas 3a and 3b have a maximum correlation coefficient of 0.76, and the vertical line shows area 3a leading area 3b by 29 milliseconds (ms). As a control, the autocorrelations (e.g., 3a–3a, 3b–3b, etc.) all show correlation coefficients of one and lag of zero ms. [Color figure can be viewed in the online issue, which is available at http://wileyonlinelibrary.com.]