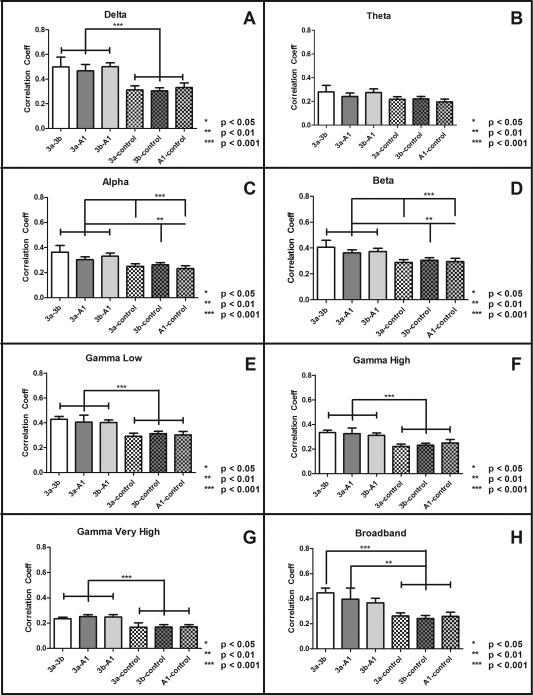
Figure 3.

Inter‐areal correlation coefficients of spontaneous LFP signals in different frequency bands across different ROI pairs. (A–H) Bar plots of peak inter‐areal correlation coefficients (r values) of six ROI pairs in delta (A), theta (B), alpha (C), beta (D), gamma low (E), gamma high (F), gamma very high (G), and broad (H) frequency bands. Error bars indicate standard error of the mean (SEM; N = 33). Differences between inter‐areal connections calculated via Dunn's multiple comparison test post Friedman's test, (*P < 0.05, **P < 0.001, ***P < 0.001). All LFP bands, with the exception of the theta band, displayed similar correlation profiles as fMRI data presented in Figure 1B.
