
Figure 5.
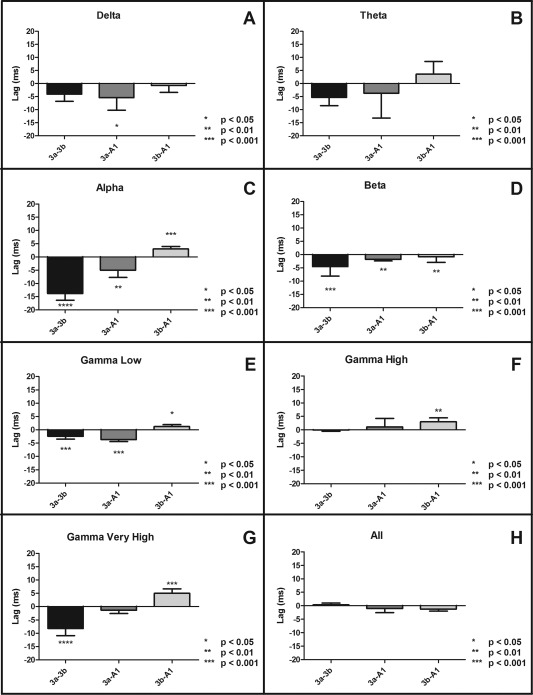
Temporal lag of peak instantaneous amplitudes of cross‐correlograms between seed areas of different ROI pairs. (A–D) Plots of lags between digit representations in sub‐regions of S1 in four different LFP frequency bands. A negative lag indicates that the first area leads the second area. Differences between inter‐areal connections were calculated via a Wilcoxon signed‐rank test, (*P < 0.05, **P < 0.001, ***P < 0.001). Error bars represent SEM (N = 33).