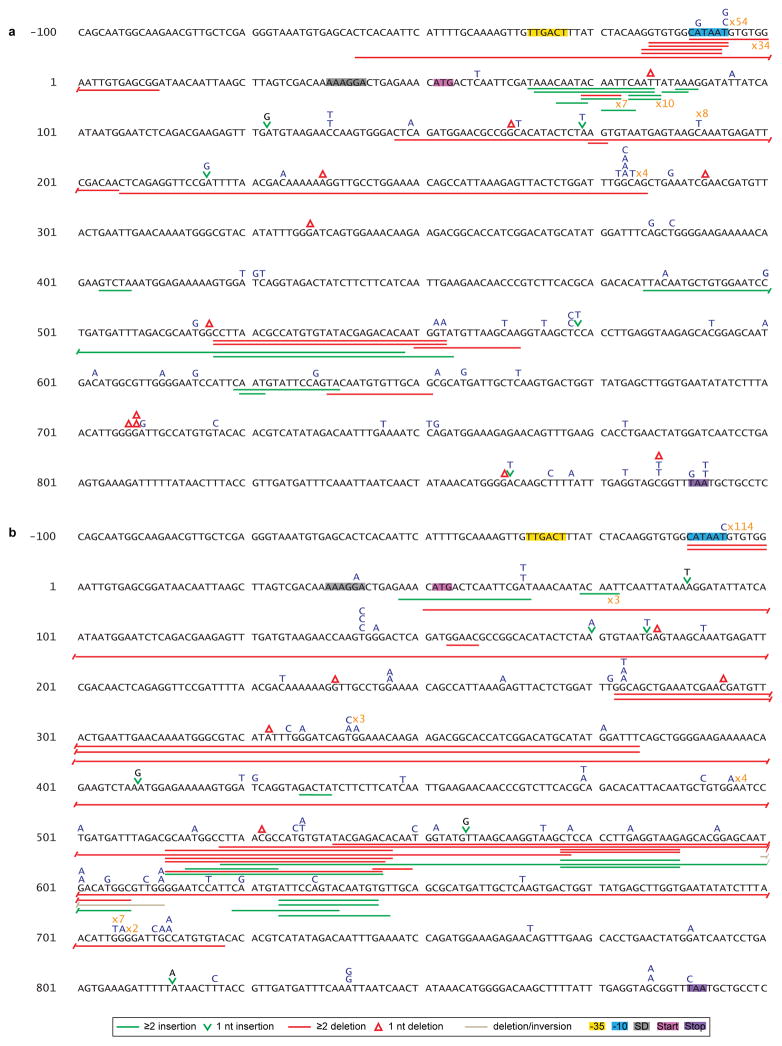
Extended Data Figure 3. Mutation spectra of thyP3 under induced transcription.
Illustrations of the mutation spectra of the thyP3 mutants obtained from fluctuation tests of: a, co-directional (n=214) and b, head-on (n=232) strains when transcription is induced (+IPTG). The thyP3 coding sequence with its promoter is shown. Sequence coordinates are indicated with reference to +1 transcription start site. The symbols used to represent different mutations are shown at the bottom, and base substitutions are shown in blue color above the sequence. The numbers marked in orange next to a mutation denote the frequency. The promoter elements, Shine-Dalgarno (SD) sequence, and start and stop codons are highlighted in each spectrum.

