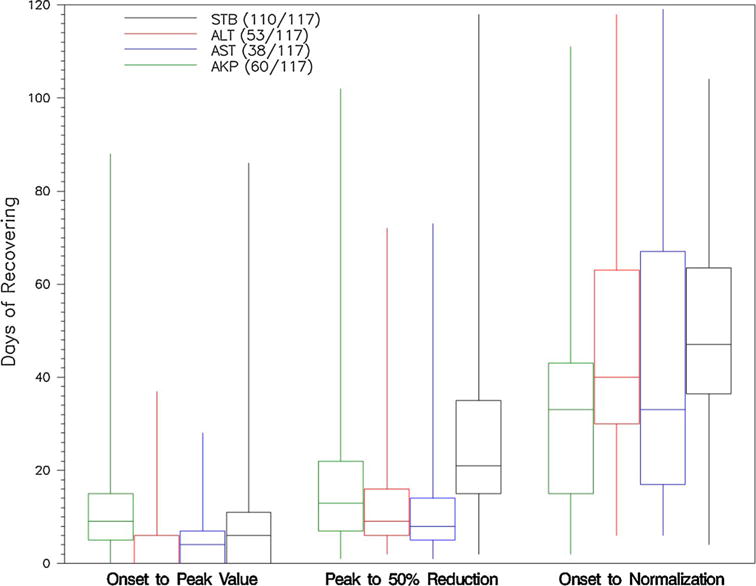
Fig. 2.

Time course of AC-DILI presented as box and whisker plot: ALT peak must be ≥×5 ULN or ×5 baseline, AST peak must be ≥×5 ULN or ×5 baseline, ALP must be ≥×2 ULN or ×2 baseline, TB peak must be ≥2.5 mg/dL. Biochemical resolution defined as ALT, AST, or ALP below ULN; TB <1.2 mg/dL
