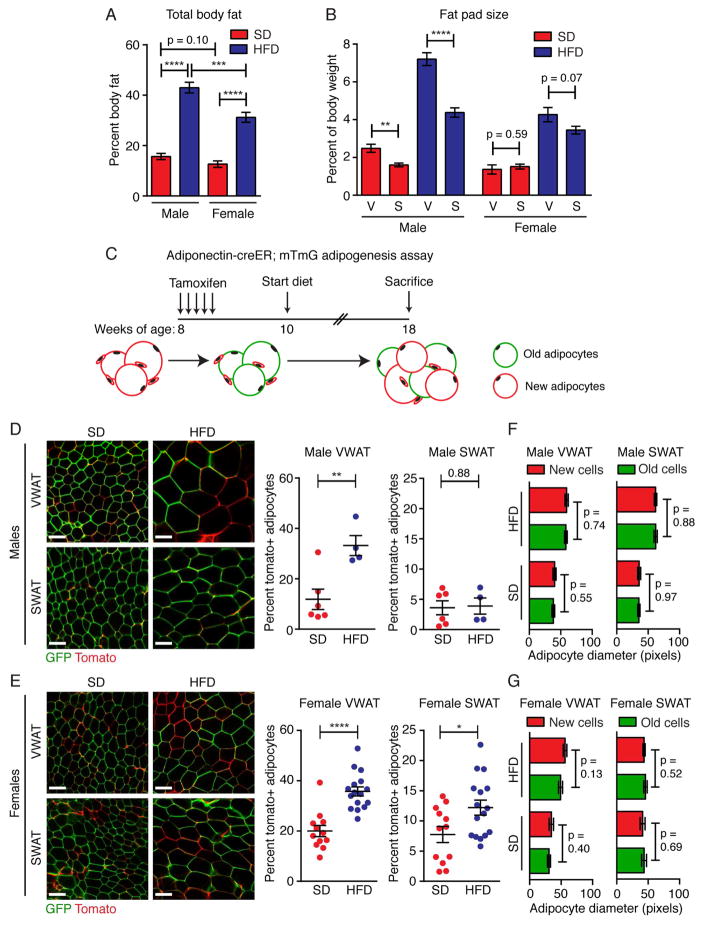
Figure 1. Adipocyte hyperplasia contributes to depot- and sex-specific WAT growth in obesity.
(A) Body fat as a percentage of total body weight after 8 weeks of SD or HFD feeding in male and female C57Bl/6J Adiponectin-creER; mTmG mice as measured by magnetic resonance imaging. (B) Weight of individual fat pads from male or female C57Bl/6J Adiponectin-creER; mTmG mice after 8 weeks of SD or HFD feeding. (In A and B, n = 9–15) (C) Experimental design for Adiponectin-creER; mTmG adipogenesis experiments. (D–E) Representative confocal images (left) and quantification (right) of adipocyte labeling in the indicated depots of Adiponectin-creER; mTmG male (D) or female (E) mice. (Males: n = 4–6. Females: n = 12–15) (F–G) Average adipocyte diameter of tdTomato+ (new) and eGFP+ (old) adipocytes from the indicated groups. (n = 4–6) Note: all data from A-E are from tamoxifen-treated animals. Significance was determined by comparing the indicated groups using an unpaired two-tailed student’s t-test. Scale bar is 100μM. Error bars represent mean ± S.E.M. See also Figure S1.

