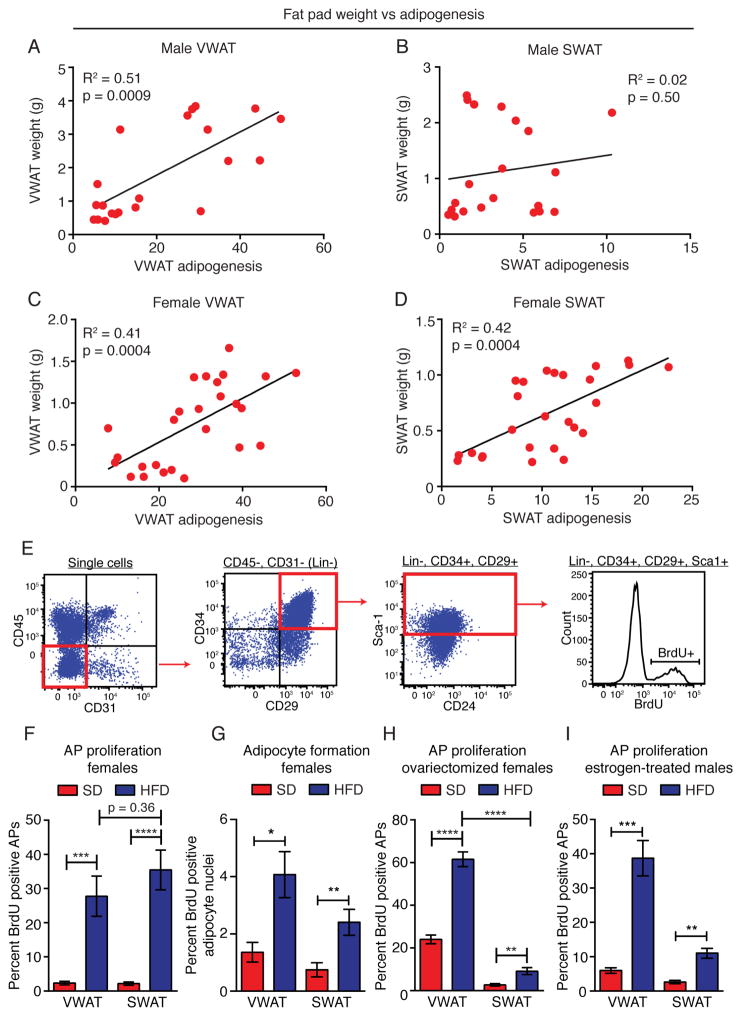
Figure 2. Fat pad weight and adipocyte precursor activation mirror depot-specific patterns of adipogenesis.
(A–D) Correlation between adipogenesis and fat pad weight in the indicated depots of male (AB) or female (C–D) mice. Each point represents one mouse. (n = 21–26) (E) Representative flow cytometry plots to measure BrdU incorporation into adipocyte precursors. (F) BrdU incorporation into APs from the indicated depot of female mice following one week of SD or HFD and BrdU treatment. (n = 5 per group) (G) BrdU incorporation into adipocyte nuclei as measured via immunofluorescence in paraffin sections following one week of BrdU treatment (pulse) and 7 more weeks of the indicated diet (chase). (n = 8–10) (H–I) BrdU incorporation into APs from the indicated depot of ovariectomized female (H) or estrogen-treated male (I) mice following one week of SD or HFD and BrdU treatment. (n = 5–10) Significance in A–D was determined using Spearman’s non-parametric two-tailed correlation analysis. Significance in F–I was determined by comparing the indicated groups using an unpaired two-tailed student’s t-test. Error bars represent mean ± S.E.M. See also Figure S2.

