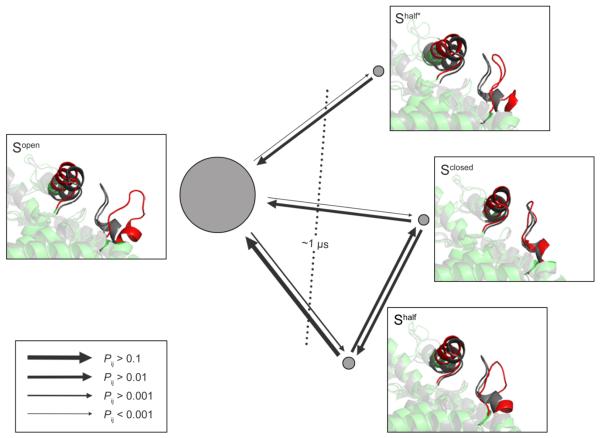
Figure 2.
Representative structures, equilibrium distribution, and kinetics of the four metastable protein states. The arrowed lines represent the transition probabilities between the metastable states. The areas of the discs are proportional to the probabilities of the corresponding metastable states at equilibrium. The dashed line represents the slowest relaxation time scale and its corresponding transition process.

