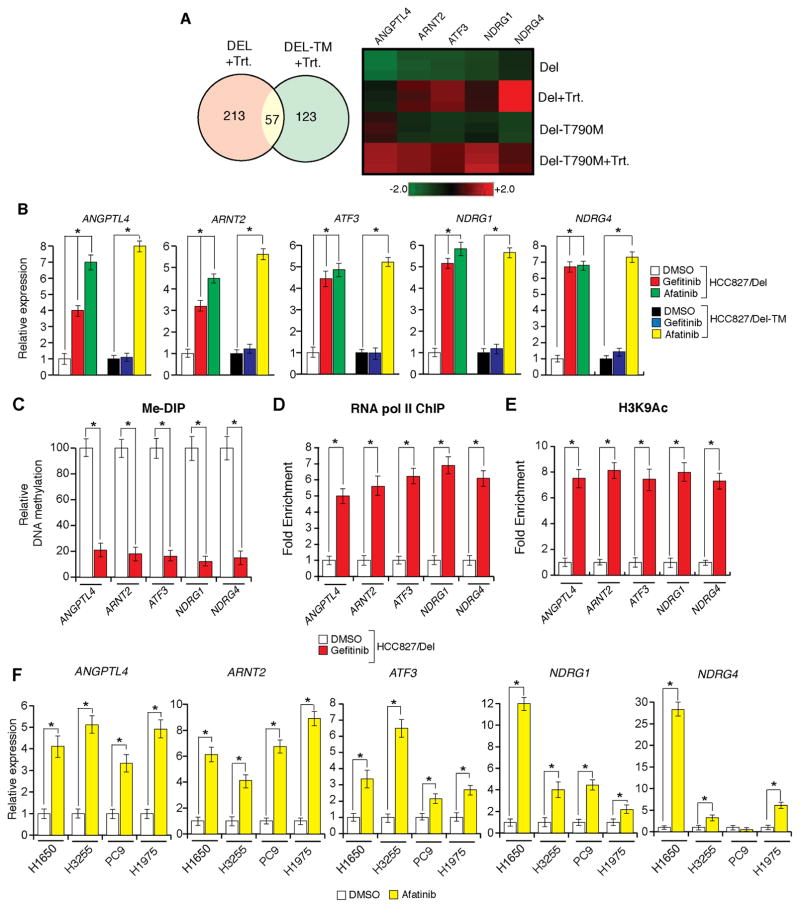
Figure 1. Oncogenic EGFR is necessary for epigenetic silencing of TSGs in lung cancer cells (See also Figure S1).
(A) (Left) Venn diagram shows the number of genes that are commonly or specifically upregulated in HCC827/Del (DEL) or HCC827/Del-TM (DEL-TM) cells after decitabine and vorinostat treatment. (Right) Heatmap of indicated genes in HCC-827/Del (DEL) and HCC827/Del-TM (DEL-TM) cells after decitabine and vorinostat treatment. (B–E) HCC827/Del cells were treated with gefitinib (0.1 μM), afatinib (0.1 μM), or DMSO for 48 h. (B) mRNA expression for the indicated TSGs was measured by RT-qPCR. Gene expression was normalized with respect to GAPDH mRNA expression. Relative expression for the indicated genes in drug-treated cells compared to DMSO-treated cells is plotted. (C) DNA methylation of CpG islands in the promoters of the indicated genes was measured using Me-DIP analysis. The percent of CpG island DNA methylation for the promoters of the indicated genes in drug-treated cells is compared with that of DMSO-treated cells. (D) RNA polymerase II enrichment on TSG promoters was measured via ChIP assay. Relative enrichment in drug-treated cells is compared with that of DMSO-treated cells. (E) Histone H3 lysine 9 acetylation (H3K9-Ac) marks on the indicated gene promoters were measured. Relative amounts of H3K9-Ac marks in drug-treated cells are shown relative to those observed in DMSO-treated cells. (F) The indicated EGFR-mutant lung cancer cell lines were treated with afatinib (0.1 μM) or DMSO for 48 h. mRNA expression levels for the indicated TSGs were measured via RT-qPCR. Gene expression was normalized with respect to GAPDH mRNA expression. Relative expression levels for the indicated genes in drug-treated cells are compared with those of DMSO-treated cells. *p < 0.05.

