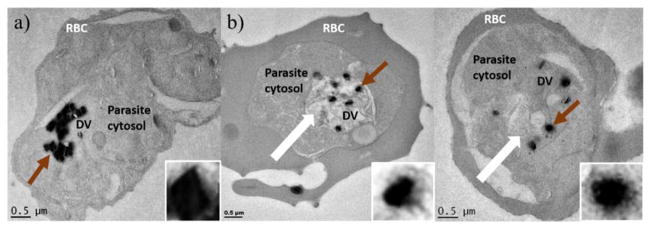
Figure 10.
TEM images of human erythrocytes infected with P. falciparum showing a) an untreated control and b) two examples of cells treated with 15i. The thick white arrows show the swollen DVs of treated cells. The brown arrows indicate the Hz crystal in the DV which has been enlarged and adjusted (20% brightness, 20% contrast in each) for clarity to readily discern the difference between crystal forms in untreated vs treated samples.

