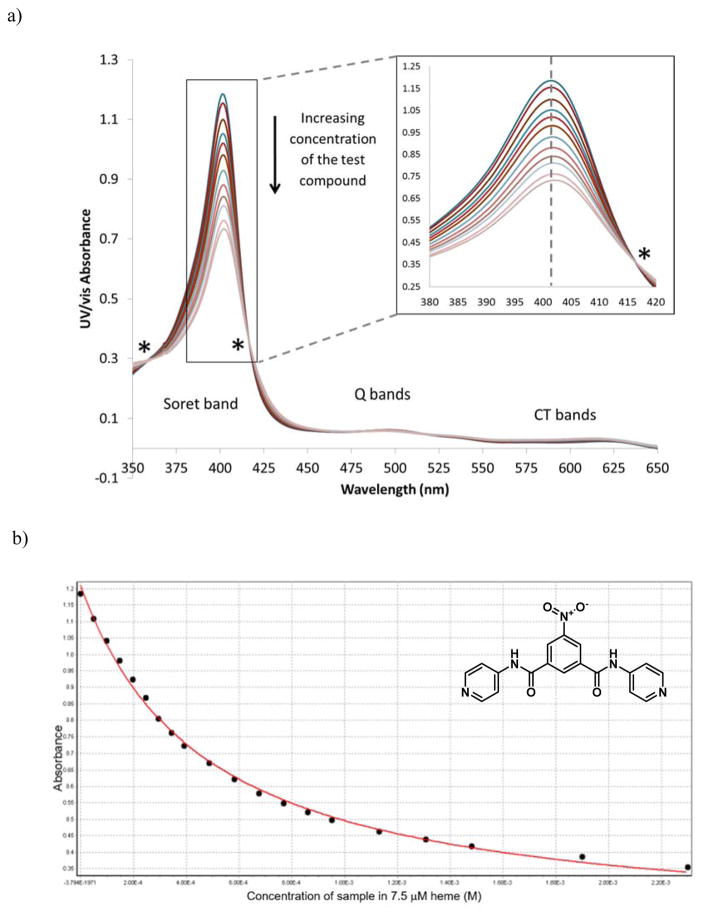
Figure 13.
Measurement of the association constant between compound 15a and Fe(III)PPIX at pH 7.5 in 40% v/v DMSO. Plots of a) the hypochromic effect on the Fe(III)PPIX absorbance spectrum with increasing compound concentration, exhibiting isosbestic points (*) and b) the maximum Fe(III)PPIX absorbance vs the concentration of compound 15a fitted to a 1:1 association isotherm.

