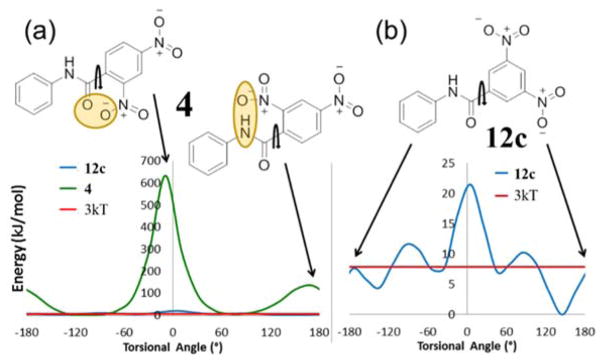
Figure 3.
Free energy diagrams for rotation around the indicated bond where 0° or ±180° represents the flat conformation for (a) purchased compound 4 (βH inactive – shown in green) compared to synthesized compound 12c (βH active – shown in blue) and (b) compound 12c (βH active). The value 3kT represents the thermally accessible energy value at 37 °C. Note the difference in scale of the y-axes (a) and (b).

