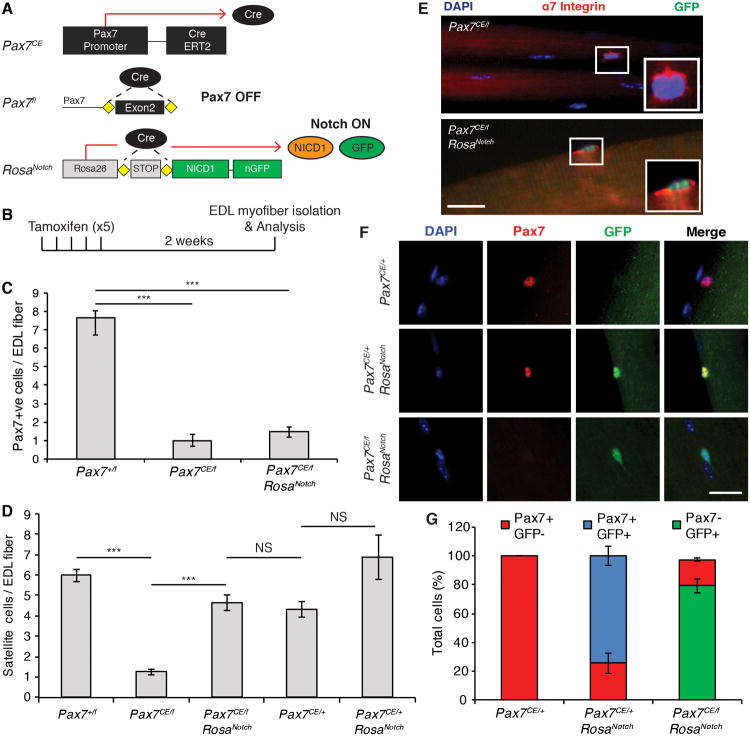
Figure 1. NICD1 Rescues the Loss of Pax7CE/f Satellite Cells.
(A) Schematic describing the alleles used and the genetic approach used to activate NICD in Pax7CE satellite cells. CreERT2 driven from the Pax7 promoter simultaneously promotes the excision of exon 2 of Pax7 and the expression of the Notch intracellular domain (NICD1) from the Rosa 26 locus. NICD cells can be traced by the expression of iRES-GFP. See also Figure S1.
(B) Schematic of the tamoxifen regimen used in this study. 6-7 week old mice were given tamoxifen via IP injection for 5 consecutive days. Satellite cells were analyzed 2 weeks after the last tamoxifen injection.
(C) Graph shows the number of Pax7+ satellite cells per EDL fiber analyzed immediately after isolation. Data are shown as mean ± SEM. n=3; >50 fibers per genotype were counted. ***p≤0.001.
(D) Quantification of the number of satellite cells per EDL fiber. n=6; >50 fibers per genotype were counted. ***p≤0.001.
(E) Immunofluorescence staining of satellite cells on EDL myofibers stained for α7-Integrin (red) and GFP (green). Nuclei were counterstained with DAPI (blue). GFP is detected only in NICD+ satellite cells. Insets show cropped image of single satellite cells. Scale bar represents 100μm.
(F) Representative immunofluorescence staining showing lack of GFP expression in PaxCE/+:Rosa+/+ satellite cells (upper panel). Pax7 and GFP were detected in Pax7CE/+:RosaNotch satellite cells (middle panel). Pax7CE/f:RosaNotch satellite cells expressed GFP but not Pax7 (lower panel). Pax7 is shown in red; GFP is shown in green; and nuclei were counterstained with DAPI (blue). Scale bar represents 20μm.
(G) Graph shows the number of Pax7+ and GFP+ cells per EDL fiber isolated from mice of the indicated genotype. n=3; > 50 fibers per genotype were counted.

