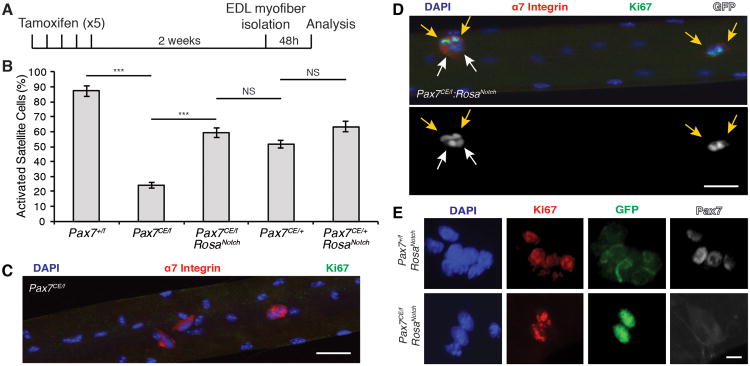
Figure 2. NICD1 Rescues the Proliferation Deficit of Pax7CE/f Satellite Cells.
(A) Schematic detailing experimental procedures performed. EDL myofibers were isolated from mice 2 weeks after the last tamoxifen injection. Single fibers were cultured cultured for 48h in growth medium (GM) to allow satellite cell proliferation.
(B) Quantification of the number of activated satellite cells (α7-Integrin/Ki67/GFP+ cells) on EDL fibers. Data are shown as mean ± SEM. n=3 mice; >50 fibers per genotype were counted. ***p≤0.001.
(C) Immunofluorescence staining of Pax7CE/f satellite cells on EDL fibers. Note that most satellite cells are Ki67-. α7-Integrin is shown in red, Ki67 is shown in green, and nuclei were counterstained with DAPI (blue). Scale bar represents 100μm.
(D) Immunofluorescence staining of tamoxifen treated Pax7CE/f:RosaNotch satellite cells on EDL fibers. Note that NICD-GFP+ cells are Ki67+ (indicated with yellow arrows). White arrows indicate α7-Integrin+/NICD-GFP+ cells negative for Ki67. α7-Integrin is shown in red, Ki67 is shown in green, GFP is shown in grey, and nuclei were counterstained with DAPI (blue). Scale bar represents 100μm.
(E) Representative images of satellite cells on EDL fibers. NICD1-GFP+ cells from tamoxifen treated Pax7+/f:RosaNotch satellite cells are Pax7+ and GFP- (upper panel). Pax7CE/f:RosaNotch are KI67+ and Pax7− (lower panel). Ki67 is shown in red, GFP is shown in green, Pax7 is shown in grey, and nuclei were counterstained with DAPI (blue). Scale bar represents 10μm. See also Figure S2.

