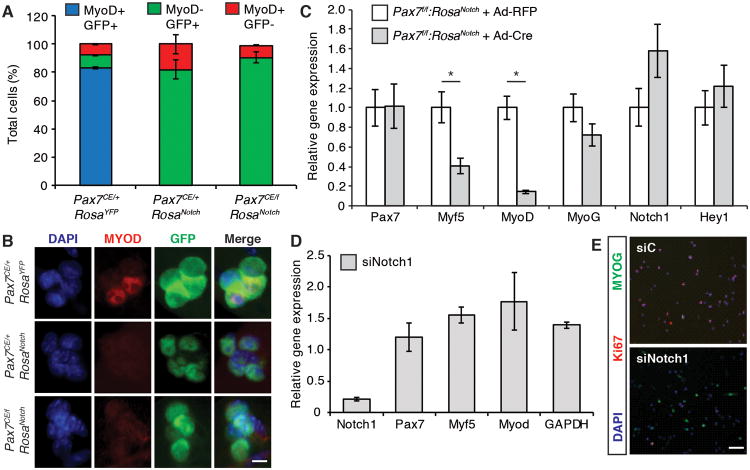
Figure 3. NICD1 Inhibits the Myogenic Program of Satellite Cells.
(A) Quantification of the number of MyoD+ and MyoD- satellite cells cultured on EDL myofibers cultured for 48h in standard myofiber media. Cell number was normalized to total GFP+ cells. Data are shown as mean ± SEM. n=3; >50 fibers were counted per genotype.
(B) MyoD expression in satellite cells from Pax7CE/+:RosaYFP (upper panel), Pax7CE/+:RosaNotch (middle panel) and Pax7CE/f:RosaNotch (lower panel) EDL fibers. MyoD is shown in red, GFP is shown in green, and nuclei were counterstained with DAPI (blue). Scale bar represents 10μm.
(C) qRT-PCR of Pax7, Myf5, MyoD, Myogenin (Myog), Notch1 and Hey1 from Pax7f/f RosaNotch primary myoblasts infected with an adenovirus expressing Cre recombinase (Ad-Cre) or a control virus expressing the Red Fluorescent Protein (Ad-RFP). Cell lysates were collected 48h post infection. Graph shows mean mRNA expression levels (± SEM) normalized to Gapdh. n=3. *p≤0.05. See also Figure S3.
(D) qRT-PCR of primary myoblasts transfected with a cocktail of siRNAs against Notch1 (siNotch1) or with a scrambled oligonucleotide control (siC). Graph shows mean relative mRNA expression level ± SEM normalized to Gapdh. n=3. See also Figure S4.
(E) Primary myoblasts transfected with siRNA against Notch1 (siNotch1) or with control siRNA (siC) were fixed 48h post transfection and stained for Myogenin (green) and Ki67 (red). Nuclei were counterstained with DAPI (blue). Scale bar represents 200μm.

