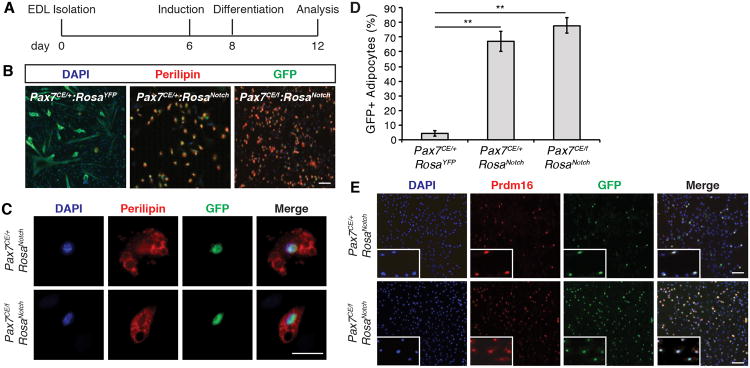
Figure 4. NICD1 Promotes Brown Adipogenesis.
(A) Timeline of the adipogenic differentiation protocol. See also Supplementary Information.
(B) Immunofluorescence of satellite cell-derived adipocytes from Pax7CE/+:RosaYFP (left); Pax7CE/+:RosaNotch (center) and Pax7CE/f:RosaNotch (right) fiber derived cultures respectively. Perilipin is shown in red, GFP is shown in green, and nuclei were counterstained with DAPI (blue). Scale bar represents 200μm.
(C) Cropped images of NICD-GFP+ cells from Pax7CE/+:RosaNotch and Pax7CE/f:RosaNotch fibers cultured in adipogenic medium. Perilipin is shown in red, GFP is shown in green, and nuclei were counterstained with DAPI (blue). Scale bar represents 100μm.
(D) Quantification of the number of GFP+/Perilipin+ cells in Pax7CE/+:RosaYFP, Pax7CE/+:RosaNotch, and Pax7CE/f:RosaNotch fiber derived cultures. Graph shows mean ± SEM; n=3; > 200 cells counted per genotype. **p≤0.01.
(E) Immunofluorescence images of NICD/GFP+ PRDM16+ cells after 15 days in culture under adipogenic conditions from Pax7CE/+:RosaNotch and Pax7CE/f:RosaNotch mice. Prdm16 is shown in red, GFP is shown in green, and nuclei were stained with DAPI (blue). Scale bar represents 200μm. Insets show cropped image of single GFP+/Prdm16+ cells.

