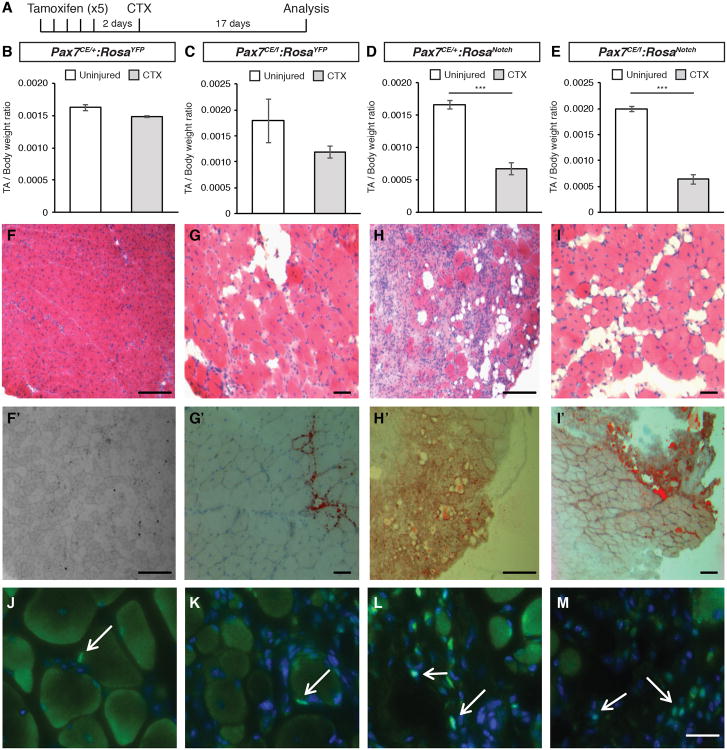
Figure 5. NICD1 Promotes in vivo Brown Fat Formation.
(A) Schematic of the regeneration experiment. Mice were injected with tamoxifen daily for 5 days. Muscle injury was performed via cardiotoxin injection in the tibialis anterior (TA) muscle 2 days after the last tamoxifen injection. Mice were harvested and TA muscles were dissected and analyzed 17 days after injury.
(B-E) Ratio of TA muscle mass normalized to total body weight. Grey bars represent injured TA muscle mass, white bars represent contralateral (uninjured) TA. Data are shown as mean ± SEM. n≥4. ***p≤0.001.
(F-I) Representative Haematoxylin and Eosin (HE) staining of TA muscle sections. Scale bar repesents 200μm.
(F′-I′) Representative Oil red O staining of TA muscle sections. Scale bar represents 200μm.
(J-M) Detection of GFP expression in prefixed muscle sections from Pax7CE/+:RosaYFP (J); Pax7CE/f:RosaYFP (K); Pax7CE/+:RosaNotch (L) and Pax7CE/f:RosaNotch (M). GFP is shown in green. Nuclei were counterstained with DAPI (blue). Scale bar represents 100μm. See also Figure S5.

