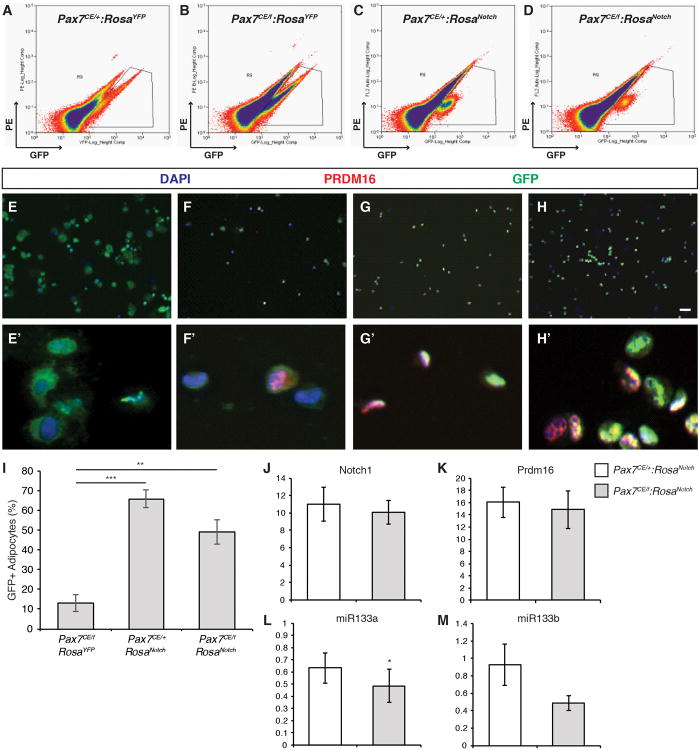
Figure 6. NICD1 Cells Express Markers of Brown Adipocytes in vivo.
(A-D) FACS profiles of prospectively isolated satellite cells from injured muscles. Endogenous GFP expression was used to gate for satellite cells.
(E-H) A portion of FACS sorted satellite cells were cytospun and fixed immediately after sorting. GFP is shown in green, Prdm16 is shown in red, and nuclei were counterstained with DAPI (blue). Scale bar represents 100μm. E′-H′: cropped images of GFP+/Prdm16+ cells.
(I) Quantification of the number of GFP+/PRDM16+ cells from Pax7CE/f:RosaYFP, Pax7CE/+:RosaNotch, and Pax7CE/f:RosaNotch injured muscles expressed as the percentage of GFP+ cells that express PRDM16. Data are shown as mean ± SEM; >150 cells counted per genotype. **p≤0.01 and ***p≤0.001.
(J-M) q-PCR analysis of total Notch1 (J), Prmd16 (K), miR-133a (L) and miR-133b (M) in prospectively isolated NICD/GFP+ cells from Pax7CE/+:RosaNotch (white bars) and Pax7CE/f:RosaNotch (grey bars) injured muscles. Graphs show mean mRNA expression level ± SEM. Gene expression was normalized to ppia, and expressed relative to control (Pax7CE/+:RosaYFP). n≥3. *p≤0.05. See also Figure S6.

