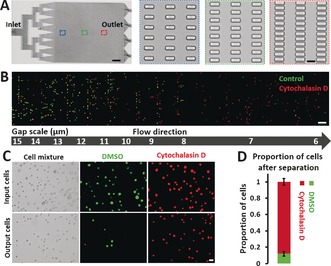
Figure 1.

Performance of MS‐Chips for cell separation. A) The complete structure of a mechanical separation chip (MS‐Chip) (scale bar: 4 mm). Rectangular microposts are shown with gap widths that decrease from 15 μm to 6 μm (scale bar: 15 μm). B) Fluorescence images of DMSO and Cytochalasin D treated MDA‐MB‐231 cells trapped in an MS‐Chip with a flow rate of 25 μL min−1. DMSO and Cytochalasin D treated cells were stained with CellTracker Green CMFDA Dye and CellTracker Red CMTPX Dye, respectively (scale bar: 100 μm). C) Comparison of input and output cells in a typical DMSO and Cytochalasin D treated separation of MDA‐MB‐231 cells with a flow rate of 75 μL min−1. Both bright‐field and fluorescent images are presented (scale bar: 30 μm). D) The proportion of cells after separation in (C) was quantified. Error bars indicate standard error of the mean (SEM; n=3).
