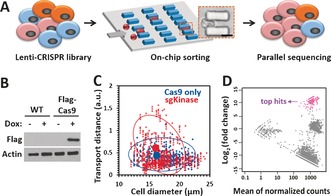
Figure 2.

CRISPR‐Cas9‐mediated loss‐of‐function screen for cell deformability. A) Illustration of the CRISPR‐Cas9 and microfluidic chip screening strategy. Cells were transduced with a lentiCRISPR kinase library and sorted by deformability in an MS‐Chip. The flexible cells were allowed to flow out of the MS‐Chip (the output) and collected for parallel sequencing together with the untreated whole cells (the input). Cell deformation was visualized by microscopy as a cell passed through a microconstriction (scale bar: 10 μm). B) Western blot analysis of nontransduced MDA‐MB‐231 cells and MDA‐MB‐231 cells transduced with a doxycycline‐inducible FLAG‐Cas9 construct upon doxycycline induction. Actin was used as the loading control. C) Statistical analysis of the on‐chip transport distance (at a flow rate of 25 μL min−1) versus cell diameter for the CRISPR kinase‐KO cells. Cells expressing FLAG‐Cas9 only were used as the control. The red and blue circles indicate 80 % confidence intervals from the means. The means are depicted by solid circles. D) MA plot of mean normalized counts versus log2(fold change) for the output and input sgRNAs. The arrow indicates the top sgRNA hits with log2(fold change)>7 and an adjusted p value of <0.001.
