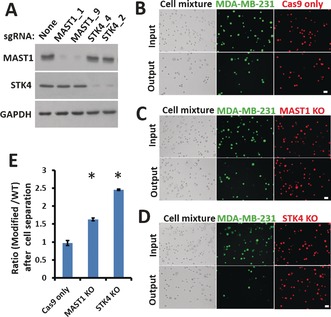
Figure 3.

Validation of top hits on a chip assay. A) Western blot analysis of WT and sgRNA‐modified MDA‐MB‐231 cells one week after infection. Glyceraldehyde‐3‐phosphate dehydrogenase (GAPDH) was used as the loading control. B–D) Comparisons of the input and the output cells before and after separation of WT and modified MDA‐MB‐231 cells at a flow rate of 75 μL min−1. WT cells were stained with CellTracker Green CMFDA Dye and modified cells with CellTracker Red CMTPX Dye. Both bright‐field and fluorescent images are presented (scale bar: 30 μm). E) After separation on the chip, the ratios of modified MDA‐MB‐231 cells to WT cells (B–D) were calculated. Error bars indicate the standard error of the mean (SEM; n=3). *: p values (p<0.005) were determined by the Student t‐test.
