
Figure 3.
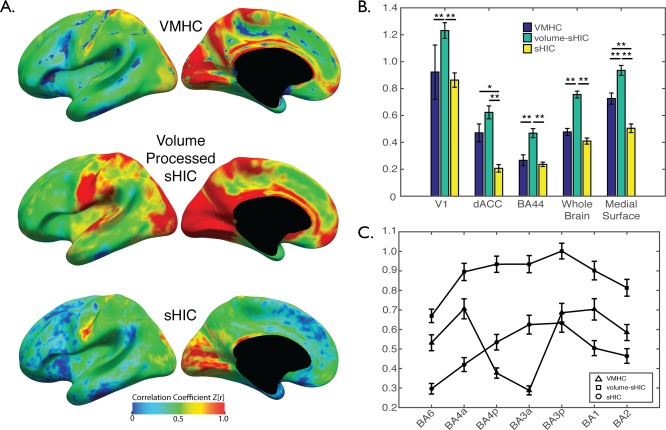
Comparison between interhemispheric techniques. (A) Average VMHC, volume‐processed sHIC, and sHIC for the Kirby 21 Scan 1 dataset. Several regions that differ between VMHC and sHIC are visible, most notably on the medial surface. (B) Whole‐brain volume processed sHIC values were significantly higher than both sHIC and VMHC. Extractions from several regions of interest reveal that, when compared to sHIC, VMHC estimates higher interhemispheric connectivity on the medial surface (i.e., dACC and medial surface ROIs), but not the lateral surface (i.e., v1, BA44) or V1. (C) The profile of interhemispheric connectivity in somatomotor cortex (BA6–BA2) calculated with VMHC demonstrated a significant dip in BA3a/p when compared to surface‐based methods, potentially due to inaccuracies introduced during volumetric template creation and registration. *p < 0.001, **p < 0.0005, corrected.