
Figure 5.
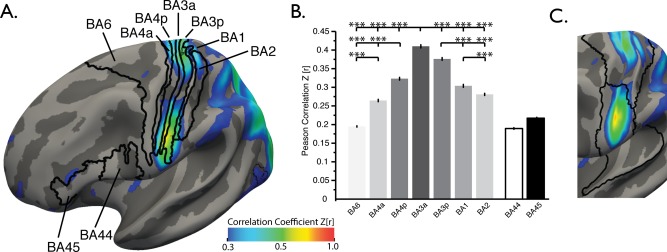
Primary motor and somatosensory sHIC. (A) Average sHIC from the BGSP dataset displayed with probabilistic Brodmann areas. (B) Extracting average sHIC from Brodmann areas revealed a pattern of decreasing homotopy from BA3a to BA6, anteriorly [F(3,3988) = 731.04, p < 0.0001 (corrected), Tukey HSD posthoc], and from BA3a to BA2, posteriorly [F(2,2991) = 199.27, p < 0.0001]. (C) The division between superior and inferior clusters of high sHIC in somatomotor regions corresponds to the border between two parcellated areas as defined in Yeo et al. [2011] [see also Power et al., 2011]. ***p < 0.0001, Tukey's HSD post hoc test.