
Figure 6.
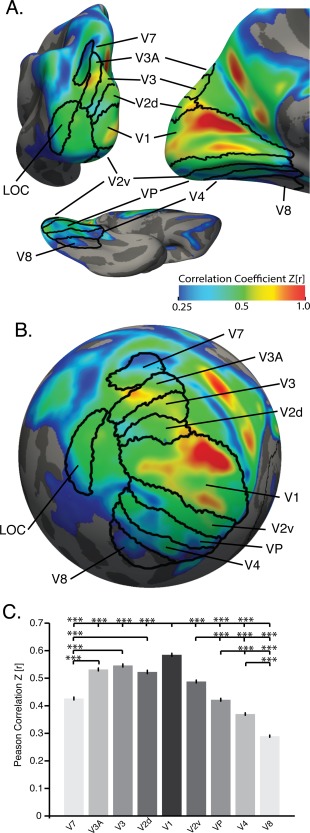
Primary visual cortex sHIC. Average sHIC from the BGSP dataset displayed with probabilistic visuotopic areas on a slightly inflated (A) and spherical (B) cortical surface for visualization. (C) Extracting average sHIC from visuotopic regions reveals a pattern of decreasing homotopy from V1 to V7, dorsally, and from V1 to V8, ventrally [F(8,8973) = 346.86, p < 0.0001]. ***p < 0.0001, corrected, Tukey's HSD posthoc test.