
Figure 7.
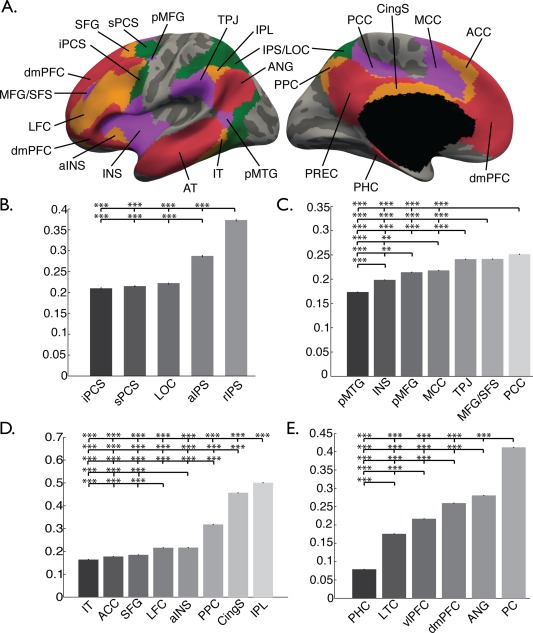
Functional surface parcellation. Regions chosen from the DAN, VAN, FPC, and DMN parcellations from Yeo et al. [2011] are displayed on lateral and medial surfaces (A). Abbreviations correspond to those regions outlined in Table 2. Average sHIC from each parcel within the (B) DAN, (C) VAN, (D) FPC, and (E) DMN is displayed in the bar graphs. **p < 0.001, ***p < 0.0001, corrected.