
Figure 9.
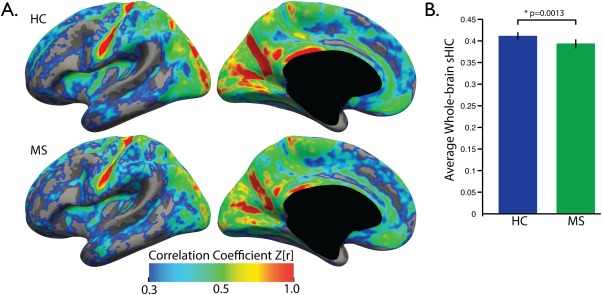
Average whole‐brain sHIC comparison. (A) Average sHIC is displayed for the HC and MS groups. (B) Mean sHIC is averaged over the entire cortex with the MS group demonstrating significantly lower average cortical sHIC compared to healthy controls (p = 0.0413).