
Figure 10.
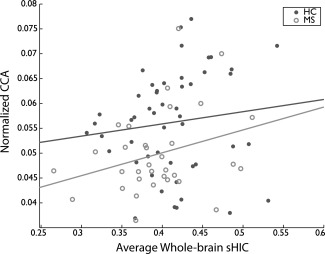
Relationship between callosal area and homotopic connectivity. Average whole‐brain sHIC and normalized CCA were not significantly correlated in the HC group (r = 0.1972, p = 0.1694, N = 51). A significant positive correlation did exist between sHIC and CCA in the MS group (r = 0.2979, p = 0.0461, N = 33).