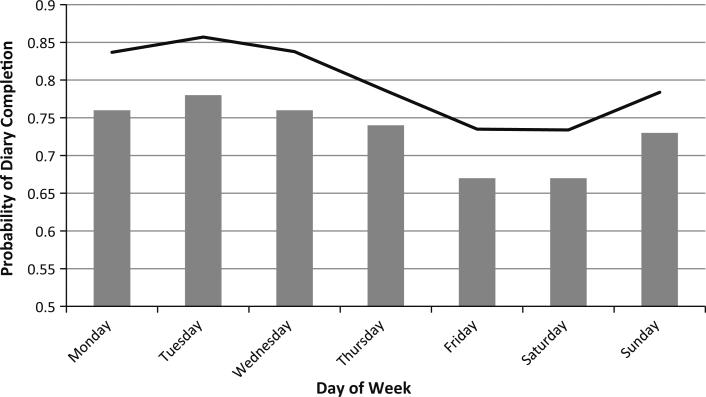
Fig. 1.
This figure displays the trigonometric function demonstrating periodicity in the missing data by day of week holding constant demographic and behavioral confounding variables. The gray histogram demonstrates the observed percentage of completed diaries by day of week; the black line is a plot of the estimated probability of completion based on the marginal fixed effects in the trigonometric model presented in Table 2; the difference between the observed and predicted probabilities is largely the result of adjusting for demographic confounding within the model

