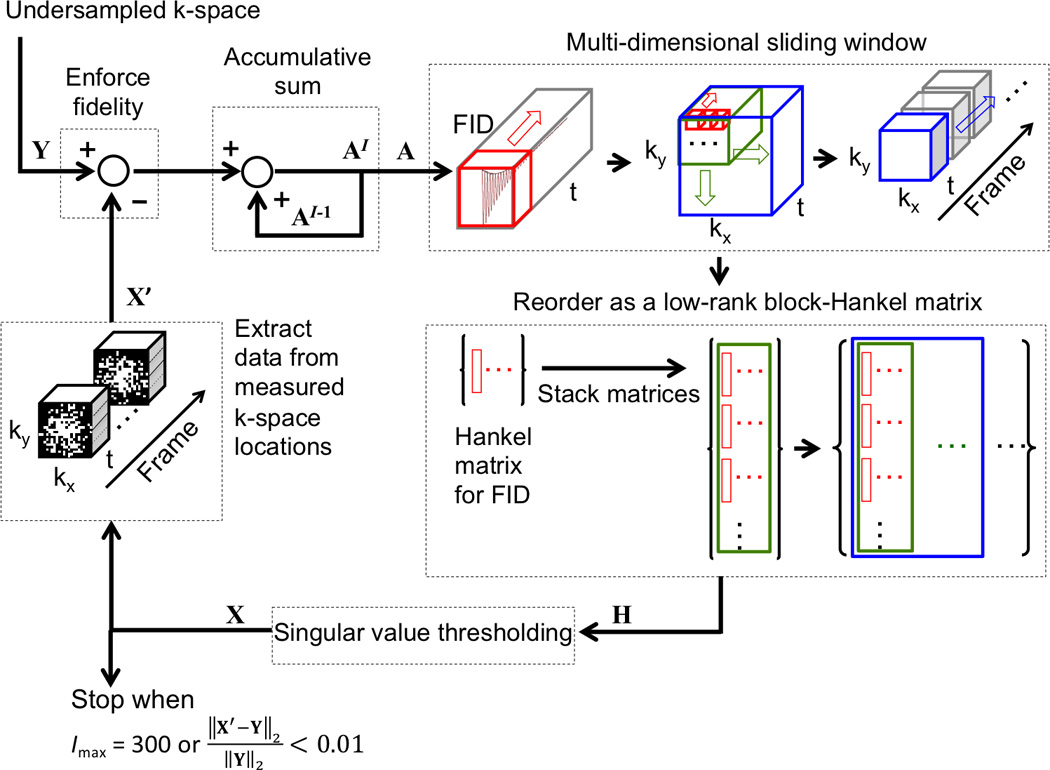
Figure 2.

Illustration of the singular value thresholding method used to reconstruct CS datasets. Y is the undersampled k-space; X is the estimated or reconstructed k-space data; X’ the k-space data at measured locations extracted from X; A is the accumulative sum of the difference between Y and X’; H is the block-Hankel matrix of A and the input of the singular value thresholding operation; and Imax for maximum iteration number. Hankel matrices for FIDs (red windows) are first stacked in a column-wise order for all voxels within a kx-ky window (green window). Then, the column-wise block matrices for all kx-ky windows and frames (blue window indicates one frame) are concatenated along each row to form a large block-Hankel matrix, H.
