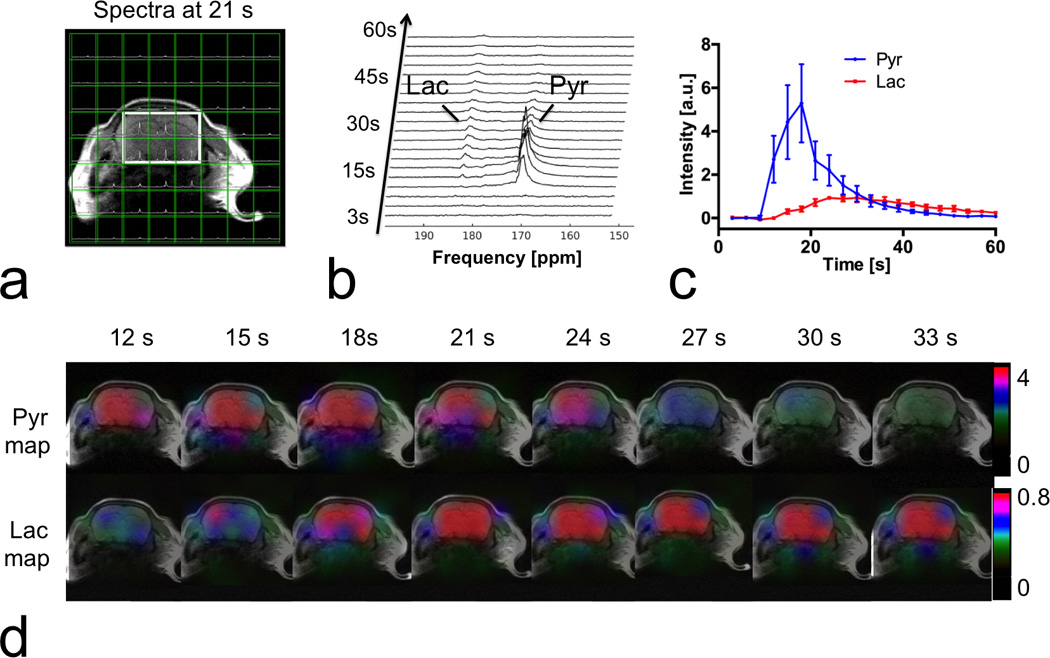
Figure 5.

Prospectively 3.8-fold accelerated CS MRSI on mouse brain, following intravenous administration of hyperpolarized [1-13C] pyruvate. (a) A mosaic view of spectra and T2 weighted MRI. Spectra were spatially localized within the head area. (b) Dynamic spectra from the sum of six voxels marked by the solid box in (a). Lactate (Lac) and pyruvate (Pyr) peaks were clearly observed. (c) Time courses of pyruvate and lactate from the marked area. (d) The 13C metabolic maps showed pyruvate and lactate dynamics, with the majority of signal localized to the brain.
