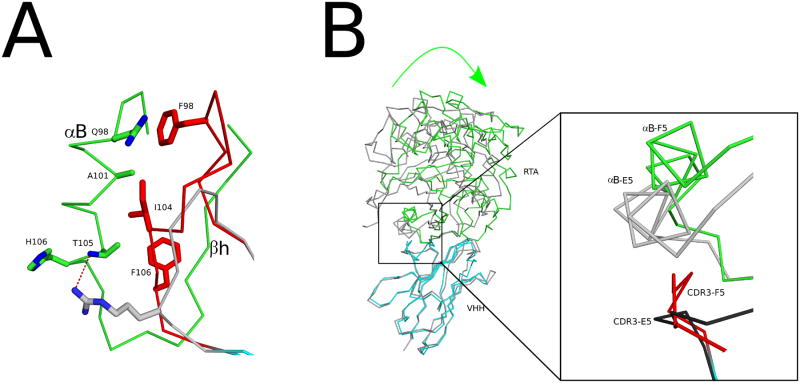
Figure 7. Different interactions with α-helix B in RTA.
(A) Shown are the super positioned Cα–traces of the RTA-F5 complex with VHH E5. The CDR3 element in F5 is colored red, while CDR3 elements of VHHs E5 is colored gray. RTA is colored green. Key residues forming interactions are drawn as sticks and color coordinated to their respective main chain color. (B) The super positioned Cα-traces of RTA in complex with VHH F5 (green-cyan, respectively) and VHH E5 (gray-gray, respectively). The green arrow illustrates direction of the 17.3° rotation of F5 relative to E5 from the center of the RTA-VHH interface. The inset illustrates the more puckered conformation of the CDR3 from F5 colored red relative to the CDR3 region of E5 in dark gray. The more protracted conformation of the E5 CDR3 generates the relative rotation of the RTA subunit within the RTA-F5 complex compared to the RTA-E5 complex.

