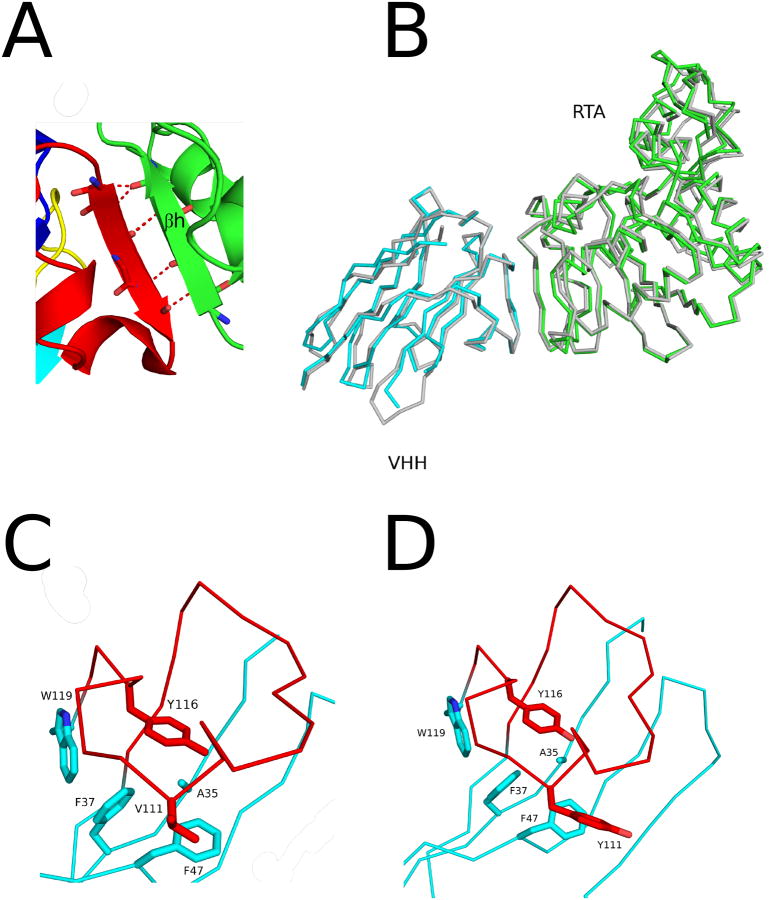
Figure 8. Close-up of of F5 CDR3 with RTA and key residues influencing F5 CDR3 conformation.
(A) Zoom in of the interface between VHH F8 and RTA depicting the main-chain hydrogen bond interactions between the CDR3 from F8 with β–strand h (residues 113-117) in RTA. RTA (green) and VHHs (cyan) are drawn as ribbon diagrams. VHH CDRs 1, 2, and 3 are colored blue, yellow, and red, respectively. Main chain atoms are drawn as sticks and color coordinated to the main chain color. Hydrogen bonds are represented as red dashes. (B) The super positioned Cα–traces of RTA in complex with VHH F8 (green-cyan, respectively) and VHH G12 (gray-gray, respectively). The Cα–traces of (C) VHH F5 and (D) VHH F5. The VHHs are colored cyan with their CDR3 elements colored red. Key residues forming hydrophobic interactions are drawn as sticks and color coordinated to their respective main chain color.

