
Figure 5.
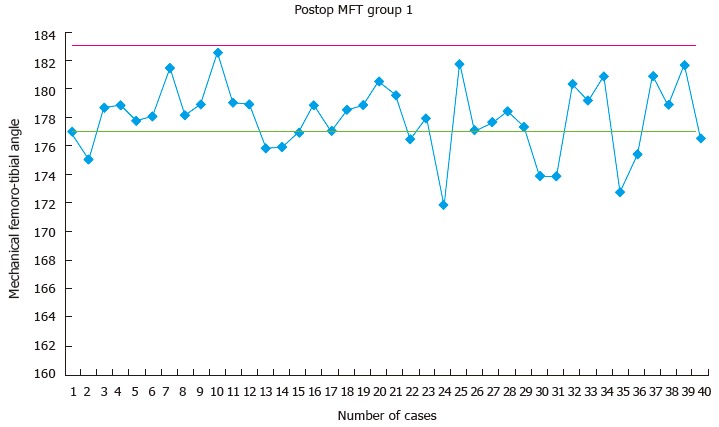
Scatter diagram depicting the distribution of the post-operative mechanical femoro-tibial angle (mechanical femoro-tibial angle) in the patient specific block group (group 1). MFT: Mechanical femoro-tibial angle.
Official websites use .gov
A
.gov website belongs to an official
government organization in the United States.
Secure .gov websites use HTTPS
A lock (
) or https:// means you've safely
connected to the .gov website. Share sensitive
information only on official, secure websites.
Scatter diagram depicting the distribution of the post-operative mechanical femoro-tibial angle (mechanical femoro-tibial angle) in the patient specific block group (group 1). MFT: Mechanical femoro-tibial angle.