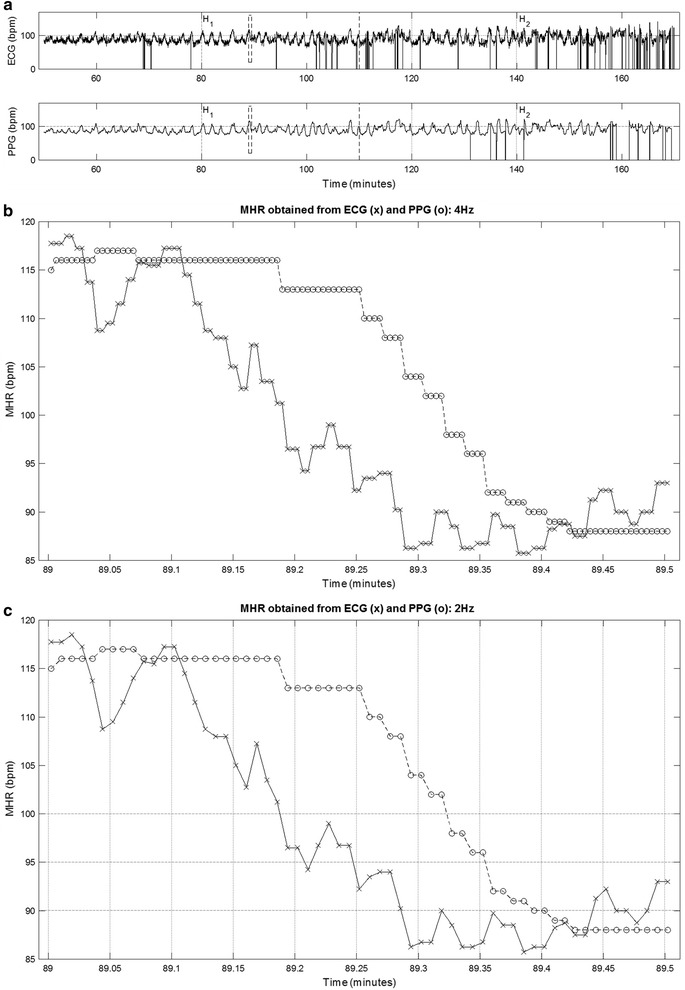
Fig. 1.

An example of a MHR tracing obtained with ECG (upper plot) and PPG (lower plot) for H1 and H2 (a). The rectangle between vertical dashed lines in a represents the 30-s segment shown in b and c, obtained respectively at 4 and 2 Hz sampling rates, with ECG (marked with a cross) or PPG (marked with a circle) signals
