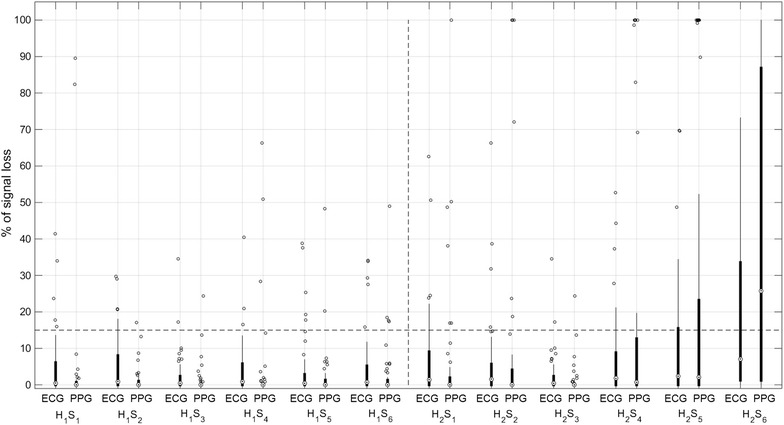
Fig. 2.

Percentage of signal loss with ECG and PPG, across all the 10-min segments Si (i = 1,…,6) of H1 and H2, represented as boxplots. The horizontal dashed line corresponds to the 15 % signal loss threshold used to exclude segments from analysis of MHR variability indices
