Figure 2.
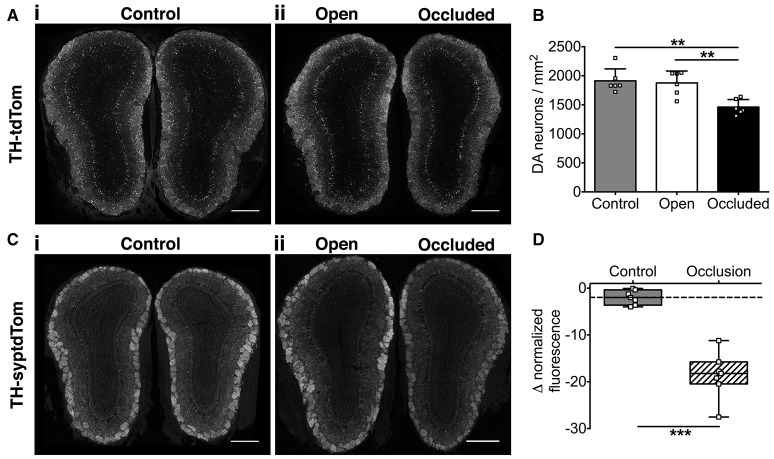
Activity-dependent decrease in OB DA neuronal and synaptic density after 7 days of naris occlusion. (A) DA neurons and (C) DA synapses in (i) control and (ii) naris-occluded mice. Scale bars: 500 μm. (B) Lower neuron density in occluded than open (**p = 0.004) or control (**p = 0.002) OBs; no difference between open and control OBs (p = 0.94) [one-way ANOVA with Tukey's test, p = 0.001, F(2, 15) = 11.14; n = 6 pooled pairs of OBs from 6 control mice and 6 pairs of open and occluded OBs from 6 naris-occluded mice]. (D) Lower synapse fluorescence intensity in occluded OBs (***p < 0.001) [Mann-Whitney Test, U = 0; n = 7 pooled pairs of OBs from 7 control mice and 7 pairs of open and occluded OBs from 7 naris-occluded mice]. Box shows median and interquartile range; whiskers show minimum and maximum values.

