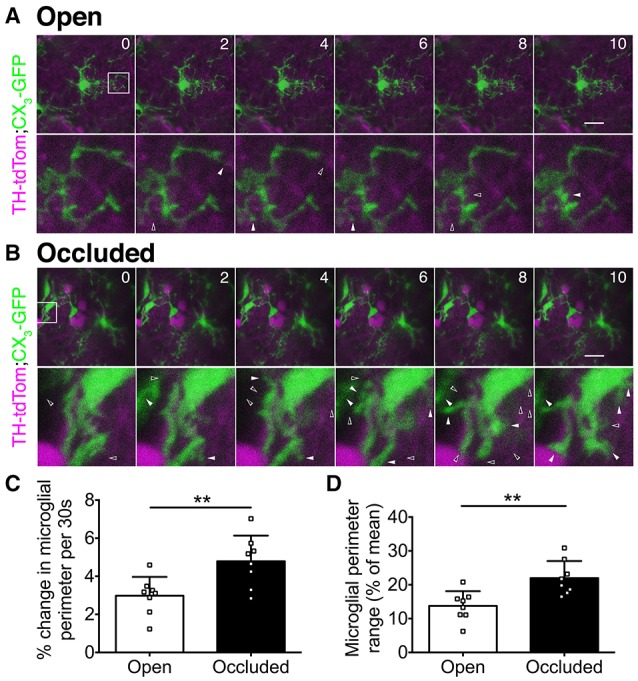
Figure 5.

In vivo 2-photon imaging reveals activity-dependent changes in microglial dynamics. (A,B) Upper: time-lapse image series showing microglial dynamics at select time points. Numbers: time (minutes). Images were captured at 30 s intervals. Scale bars: 20 μm. Lower: zoomed images of boxed regions. Left-to-right: solid-open arrowhead pairs indicate process retraction; open-solid arrowhead pairs indicate process extension. (C) Greater perimeter change in occluded OBs (**p = 0.008, t = 3.06, t-test). (D) Greater perimeter range over time in occluded OBs (**p = 0.004, t = 3.49, t-test). (C,D): n = 8 microglia from 2 open OBs and 8 microglia from 2 occluded OBs from 2 naris-occluded mice.
