
Figure 1.
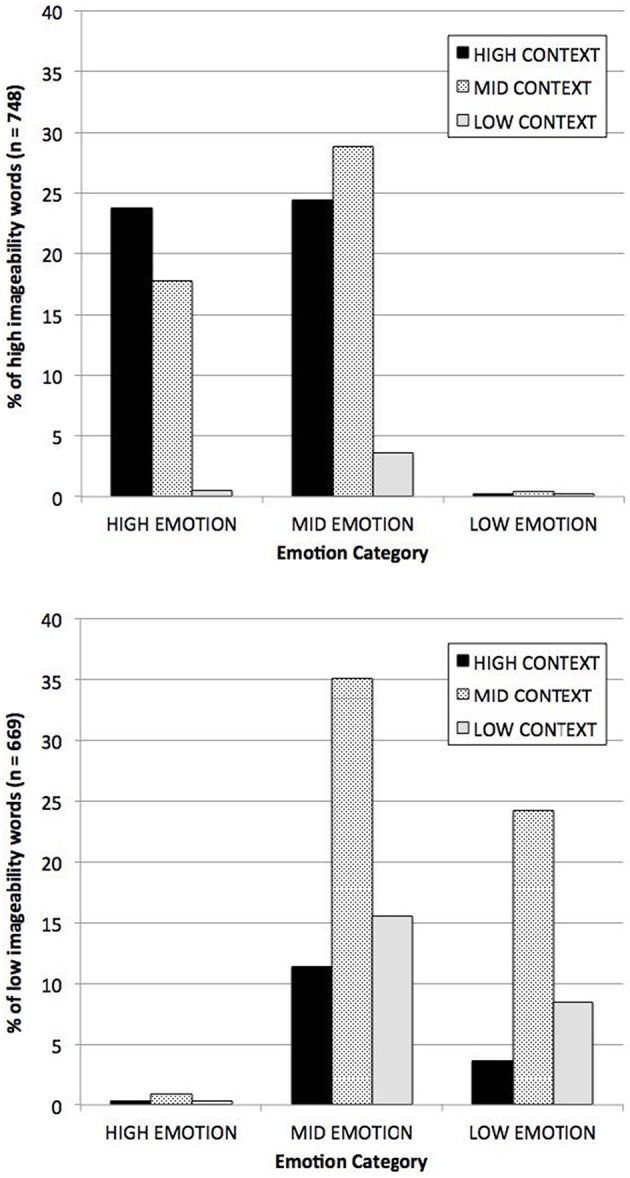
Distribution among high imageable words (above) and low imageable words (below) of context and affect measures. High and low groups were defined as outside ± 1 z, respectively. Reprinted from Westbury et al. (2013).
Official websites use .gov
A
.gov website belongs to an official
government organization in the United States.
Secure .gov websites use HTTPS
A lock (
) or https:// means you've safely
connected to the .gov website. Share sensitive
information only on official, secure websites.
Distribution among high imageable words (above) and low imageable words (below) of context and affect measures. High and low groups were defined as outside ± 1 z, respectively. Reprinted from Westbury et al. (2013).