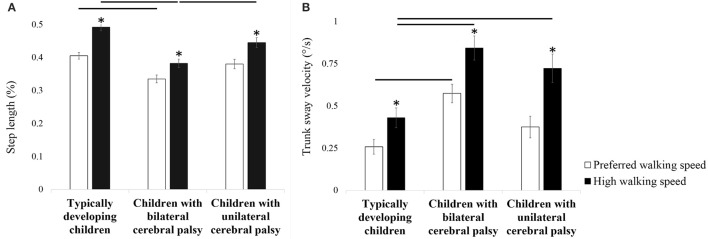
Figure 3.
Influence of increasing walking speed on step length (A) and trunk sway velocity (B). Bars and error bars represent, correspondingly, mean values and standard deviations for of the presented outcome parameter for typically developing children, children with bilateral cerebral palsy and children with unilateral cerebral palsy. White bars represent the values for the preferred walking speed conditions, black bars represent the values for the high walking speed conditions. An asterisk indicates a significant within subject group difference (p < 0.05) in the high walking speed conditions compared to the preferred walking speed conditions (Tukey's pairwise comparisons). A horizontal line indicates a significant between subject group difference (p < 0.05) for the indicated subject groups in the indicated experimental conditions (Tukey's pairwise comparisons).

