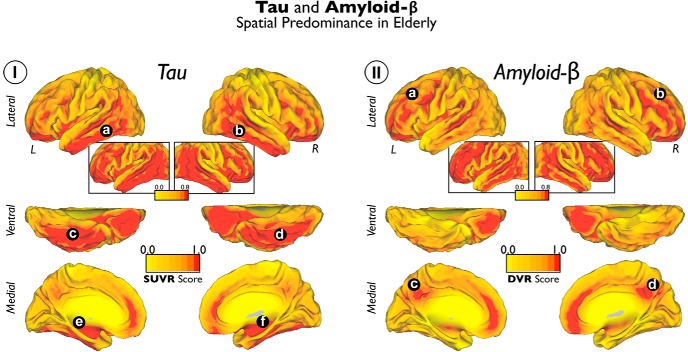
Figure 1.
Average maps of Tau and Aβ deposits in cognitively normal elderly patients. I shows the average Tau maps. II shows the average Aβ maps. Color scales represent SUVR units in I and DVR units in II. The insets of the lateral brain view are the same as the cortical surfaces but with a lenient visualization threshold. a–f indicate principal locations of Tau deposits. a–d indicate principal locations of Tau deposits.

