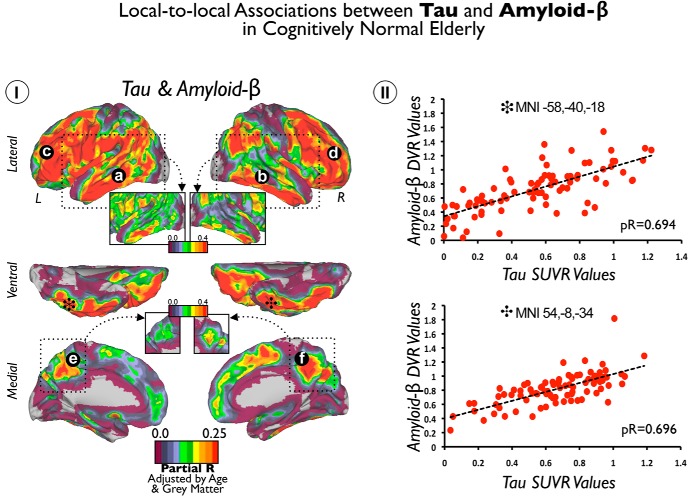
Figure 5.
Local-to-local associations between Tau and Aβ in cognitively normal elderly patients. I shows the cortical distribution of voxelwise correlations between Tau and Aβ maps. Color scales represent positive partial correlation coefficients adjusted by age and GM intensities. II shows the scatter plots of coordinates with local maxima (black stars) in I. Insets show a stringent r threshold to highlight the local maximum voxels in lateral and inferior temporal areas. a–f indicate positive correlation coefficients between local Tau deposits and local Aβ deposits.

